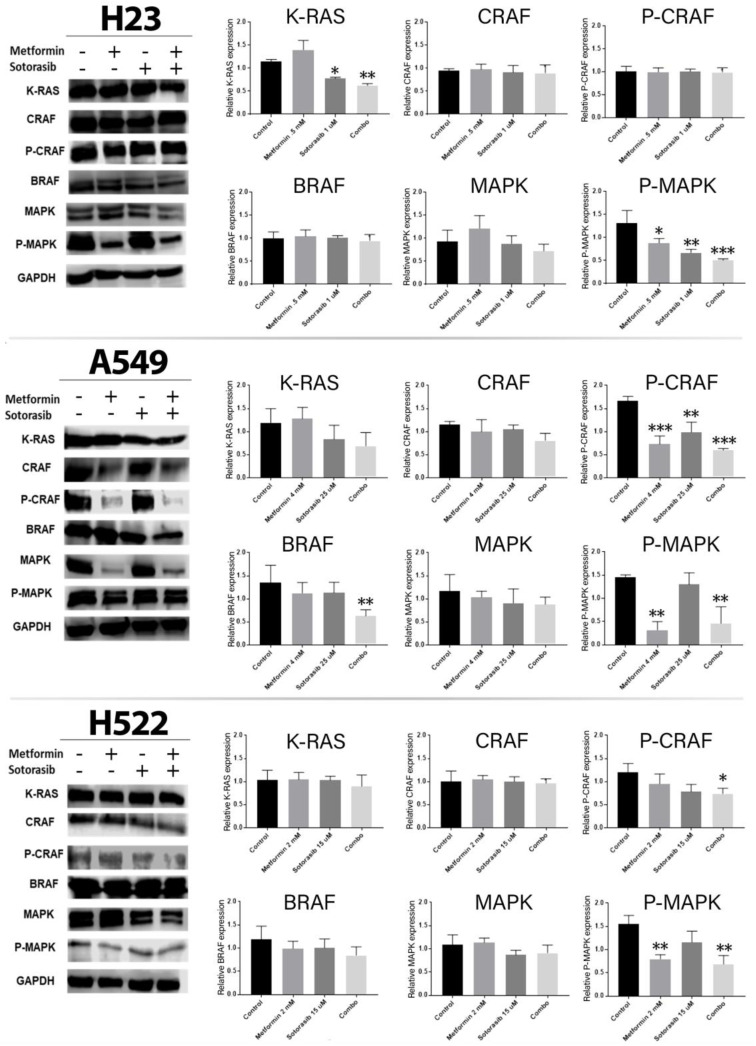
Figure 3.
Effect of the combined treatment of metformin and sotorasib on the MAPK pathway. Cells were seeded and treated for 72 h with their respective therapy, after which protein was extracted and analyzed by Western blot. GAPDH was used as endogenous control, and Western blot images were analyzed by ImageJ software version 1.54 (NIH) and represented as bars in the graphics using GraphPad Prism software version 8.0.1 (Dotmatics, Boston, Massachusetts, USA). Each bar represents three independent experiments and results of the area are presented as mean and standard deviation. Data were normalized regarding endogenous control and statistically analyzed by one-way ANOVA. * p ≤ 0.05, ** p ≤ 0.01, *** p ≤ 0.001. MAPK and p-MAPK both refer to ERK1/2 and p-ERK1/2.

