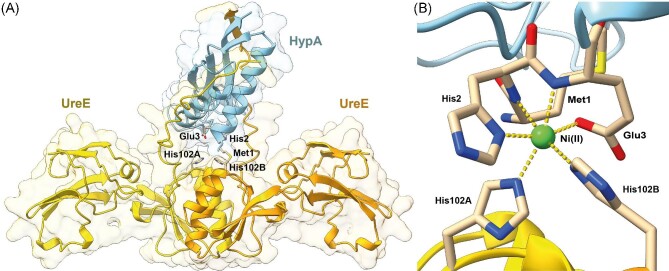
Fig. 10.
(A) Ribbon diagram and molecular surface of the apo,Zn-HypA•UreE2 complex model structure. HypA is in light blue, while UreE2 monomers are in yellow and orange. Residues involved in Ni(II) binding are in sticks, colored according to the atom type. (B) Data-based model of the Ni(II)-binding site located at the interface between HypA and UreE2. The Ni(II) ion is shown as a green sphere, while the coordination bonds are indicated with yellow dashed lines.

