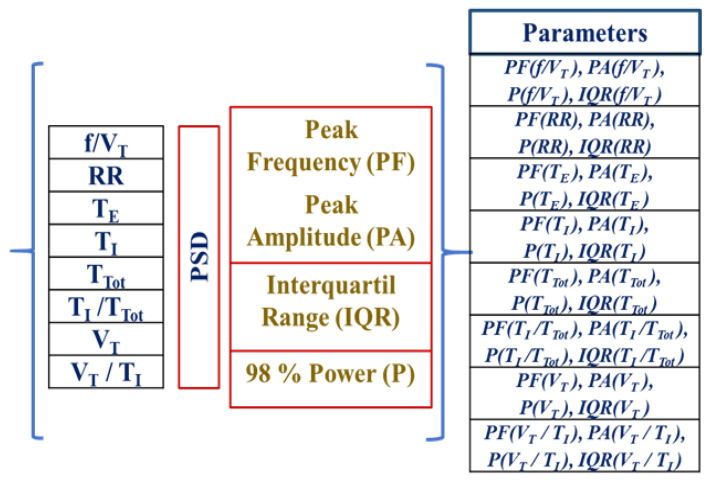
Figure 4.
Schematic representation of the 32 variables extracted from the power spectral density for each of the 8 time series that describe the respiratory and cardiac pattern. : inspiratory time, : expiratory time, : duration of the respiratory cycle, : tidal volume, : inspiratory fraction, : mean inspired flow, : frequency–tidal volume ratio, where is the respiratory rate; RR: cardiac beat-to-beat interval.

