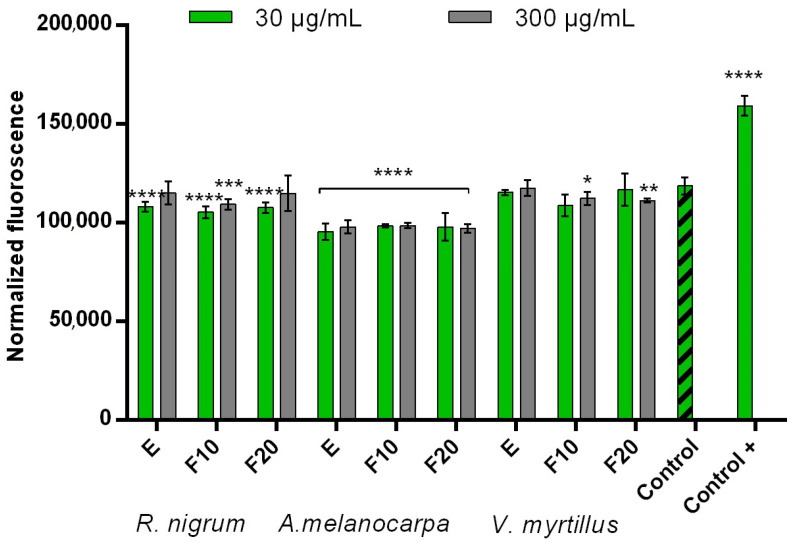
Figure 2.
Intracellular ROS levels in BJ cells exposed to extracts (E) and ferments (F10 and F20) from R. nigrum, A. melanocarpa, and V. myrtillus. Data are the mean of three independent experiments in which each sample concentration was performed in triplicate. **** p < 0.0001, *** p < 0.001, ** p < 0.01, and * p < 0.05 compared to the control.

