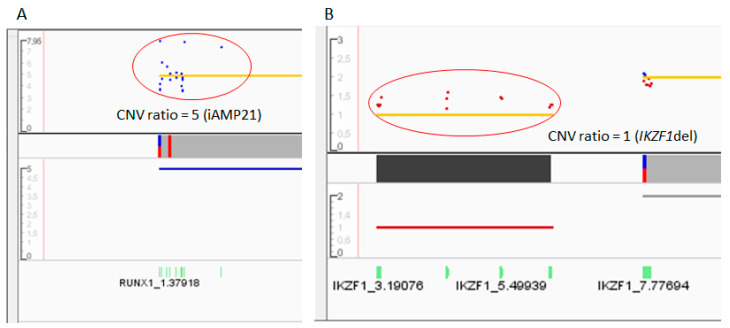
Figure 4.
Copy number variations identified by ALLseq in two different patients. The x axis shows the gene regions, while the y axis represents the copy number ratio values. The red circles highlight the gains or losses. (A) The dot plot shows a gain of RUNX1, associated with the iAMP21 entity. (B) The dot plot shows the loss of exons 4–7 of IKZF1, resulting in the main pathogenic isoform (IK6) in ALL.

