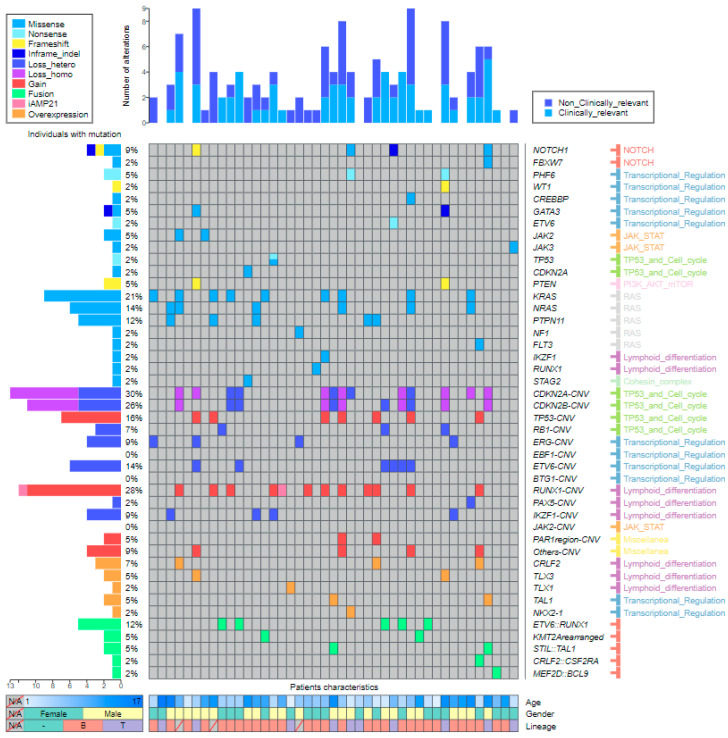
Figure 6.
Landscape plot representing ALLseq results. Altered genes are listed at the right side of the panel. Genes are arranged first by the alteration type and second by the involved pathway. The percentage of patients carrying alterations is noted at the left side of the figure. Samples are displayed as columns, with clinical relevance of mutations plotted at the top. The main patient characteristics are shown at the bottom.

