Figure 2.
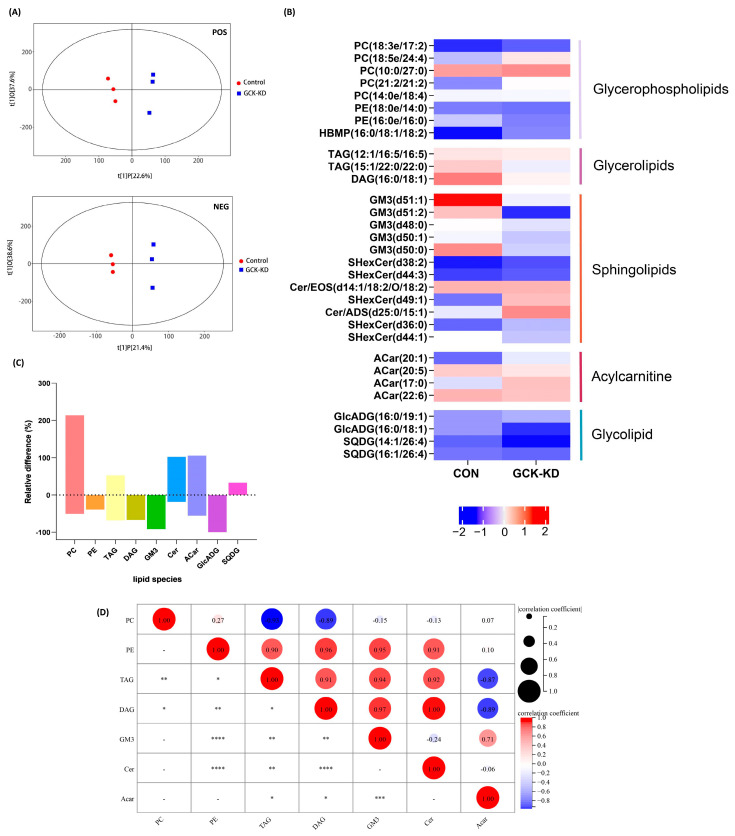
Lipidome profile of HepG2 hepatocytes after GCK knockdown. (A) Score scatter plot of OPLS-DA model for groups in negative and positive ionization modes; the R2Y and Q2 of the positive mode were 0.984 and 0.703, and 0.999 and 0.71 in the negative mode, respectively, indicating a high validity and good predictive ability of the model. (B) Heatmap analysis of the significantly altered lipid metabolites in GCK knockdown liver cells. (C) Bar plot for the relative change (percentage) of lipid species between groups. (D) Correlation matrices of lipids in GCK knockdown and control group. Sizes and colors of circle indicate correlation coefficients (positive correlation: red; negative correlation: blue). (n = 3) **** p ≤ 0.0001, *** p ≤ 0.001, ** p ≤ 0.01, * p ≤ 0.05 versus control group. Acar, Acylcarnitine; Cer, ceramides; DAG, Diacylglycerol; FA, Free fatty acid; GlcADG, glucuronosyldiacylglycerol; GM3, Ganglioside; PC, Phosphatidylcholine; PE, Phosphatidylethanolamine; SQDG, Sulfoquinovosyl diacylglycerol; TAG, triacylglycerol.

