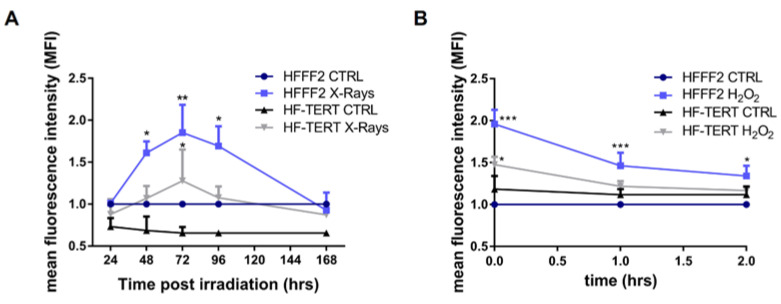
Figure 2.
Measure of oxidative stress after X-rays irradiation or H2O2 treatment. (A) ROS level in control and irradiated samples for both cell lines for 168 h post-X-rays treatment. (B) The graph represents the comparison between both cell lines after H2O2 treatment. Measure of the level of oxidative stress in all samples was done immediately after 1 h (t0) H2O2 treatment. Successively, cells are recovered with culture media and oxidative stress is measured after 1 and 2 h (t1, t2). All results are normalized to the control values of HFFF2 cells and are expressed as mean values ± SEM of the ratio between the relative fluorescence intensity and the cell number for each day analyzed. Statistical analysis is performed between treated and control samples for both cell lines. * p < 0.05; ** p < 0.01; *** p < 0.001; by one-way ANOVA test with Tukey’s post-test.

