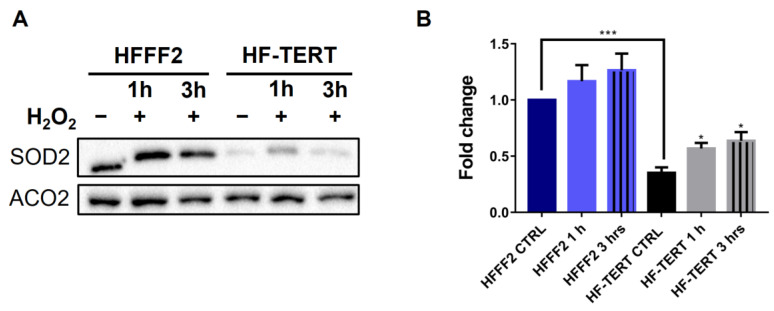
Figure 4.
SOD2 protein level evaluated after H2O2 treatment. (A) Western blot of SOD2 and Aconitase 2 (ACO2, used as a control) in HFFF2 and HF-TERT cells at 1 or 3 h of recovery after H2O2 treatment. (B) Quantification of SOD2 protein level in both cell lines after H2O2 treatment. Data represent mean ± SEM. Statistical analysis is performed between HF-TERT and HFFF2 untreated cells, or between treated and untreated HF-TERT. * p < 0.05; *** p < 0.001 by t-test.

