Figure 5.
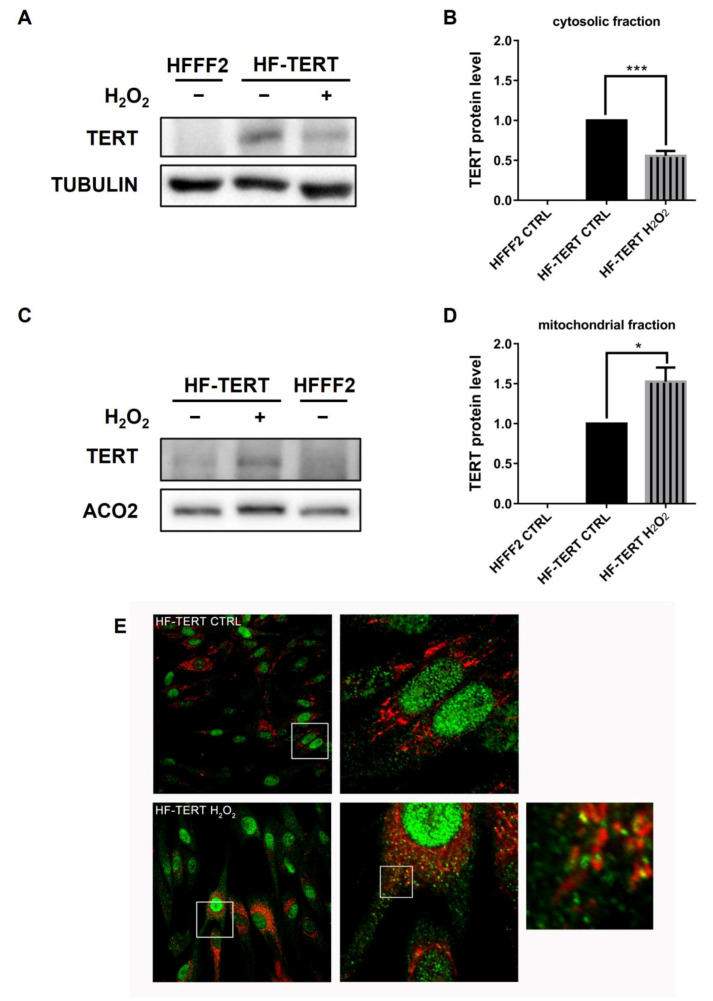
TERT localization in mitochondrial and cytosolic fraction. (A) Representative Western blot shows specific bands for cytosolic level of TERT and tubulin, used as control protein, in untreated and treated HFFF2 or HF-TERT cells. (B) Level of TERT protein in cytosol after 3 h of H2O2 treatment, normalized to tubulin signal. (C) Representative Western blot of mitochondrial level of TERT and ACO2, used as control protein, in untreated HFFF2 and in untreated and treated HF-TERT cells 3 h after treatment. (D) Quantification of mitochondrial level of TERT protein, normalized to ACO2 signal. (E) Image of cells stained for TERT antibody (green) and Mitospy (red) in untreated (upper panel) and treated (lower panel) HF-TERT cells. The enlarged images show localization of TERT protein into mitochondria. Data represent mean ± SEM. * p < 0.05; *** p < 0.001; by t-test.

