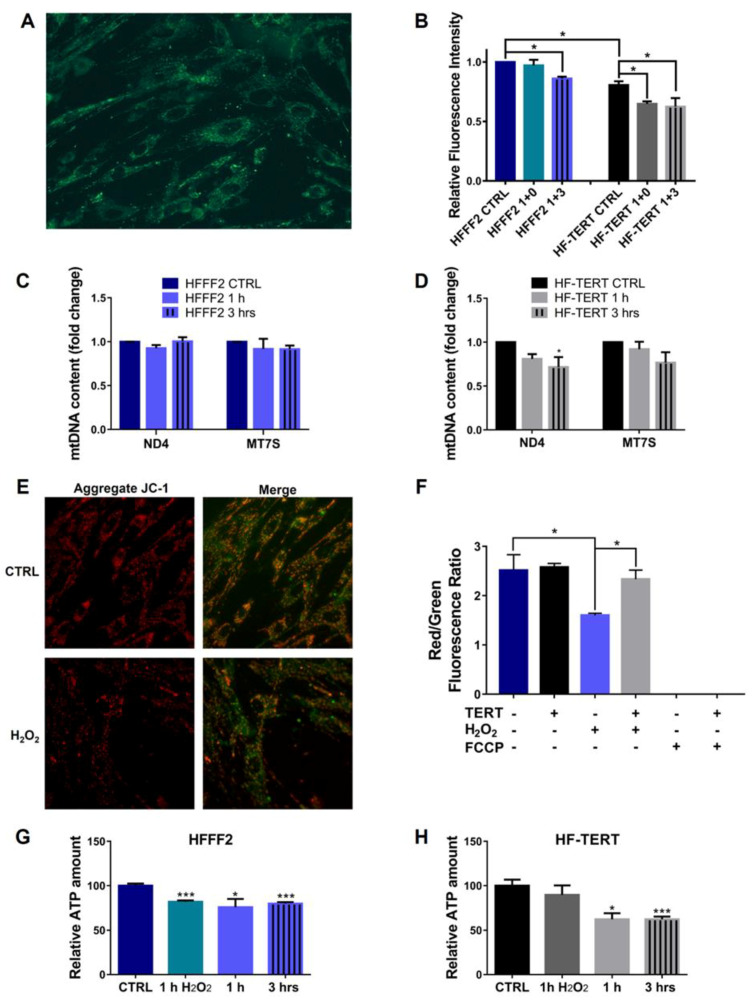
Figure 8.
Mitochondrial function and amount in untreated and treated HFFF2 and HF-TERT. (A) Representative image of HFFF2 cells stained with MitoTracker Green. (B) Mitochondrial mass in untreated and treated HFFF2 cells and HF-TERT cells immediately after 1 h, after 1 and 3 h of recovery from H2O2 treatment. (C,D) qPCR for ND4 and MT-7S mitochondrial genes in untreated and treated HFFF2 (C) and HF-TERT cells (D) after 1 and 3 h of recovery. (E) Mitochondrial membrane potential (ΔΨm) measured by JC-1, red to green fluorescence intensity ratio. (F) Quantification data of JC-1 after 1 h of H2O2. FCCP (10 μM) is used as the positive control. ATP level in untreated and treated HFFF2 (G) and HF-TERT (H) cells. All values are expressed as mean values ± SEM. Statistical analysis is performed between treated and control samples of both cells. * p < 0.05; *** p < 0.001; by t-test.

