
Fig. 2.
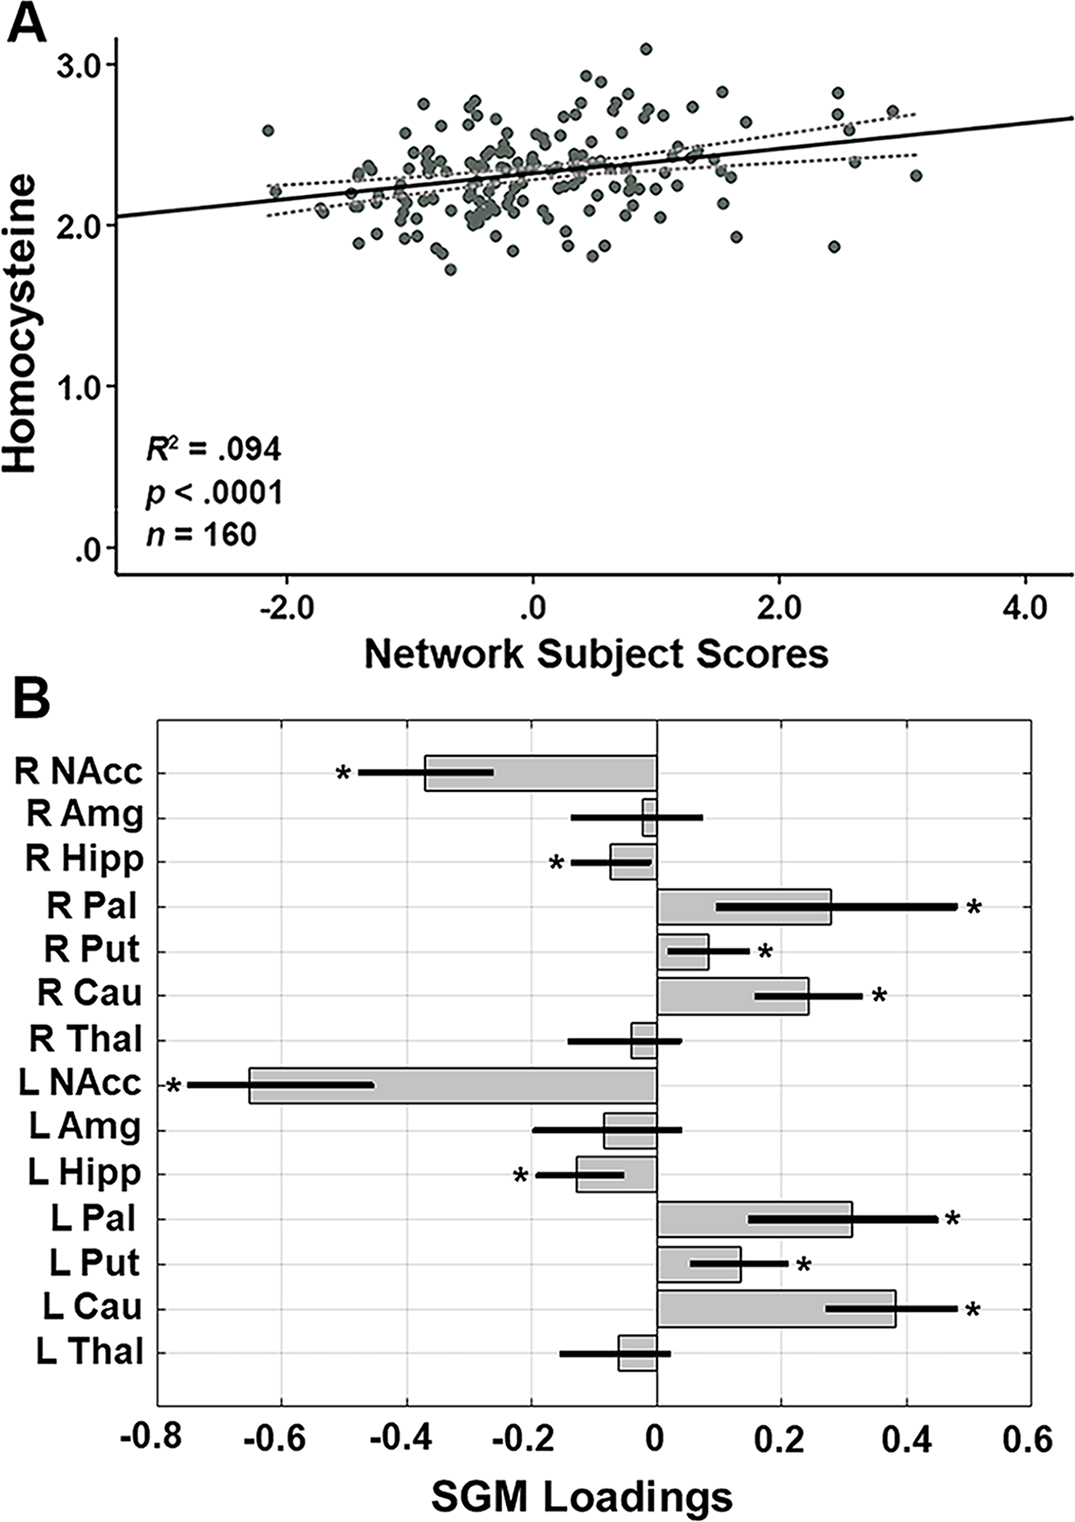
(A) SGM network subject scores and total Hcy levels. The subject scores of the Hcy-related SGM network pattern were derived from the first SSM component. Total Hcy levels were natural log transformed. The gray dotted lines represent 95% confidence intervals. The scatterplot shows that higher total Hcy levels were associated with greater expression of the SGM network pattern (R2 = .094, p < .0001, n = 160). (B) Hcy-related loadings for the SSM network pattern of the 14 SGM regions. The gray bars indicate point estimates for the loadings, black lines indicate the 95% confidence intervals from the bootstrap resampling with 10,000 iterations, and asterisks represent statistically significant regions contributing to the covariance pattern. L = left; R = right; NAcc = nucleus accumbens; Amg = amygdala; Hipp = hippocampus; Pal = pallidum; Put = putamen; Cau = caudate; Thal = thalamus; Hcy, homocysteine; SGM, subcortical gray matter; SSM, Scaled Subprofile Model.