
Figure 2. Loss of ΔNp63 and p73 impairs the post-extravasation proliferation of CSCs.
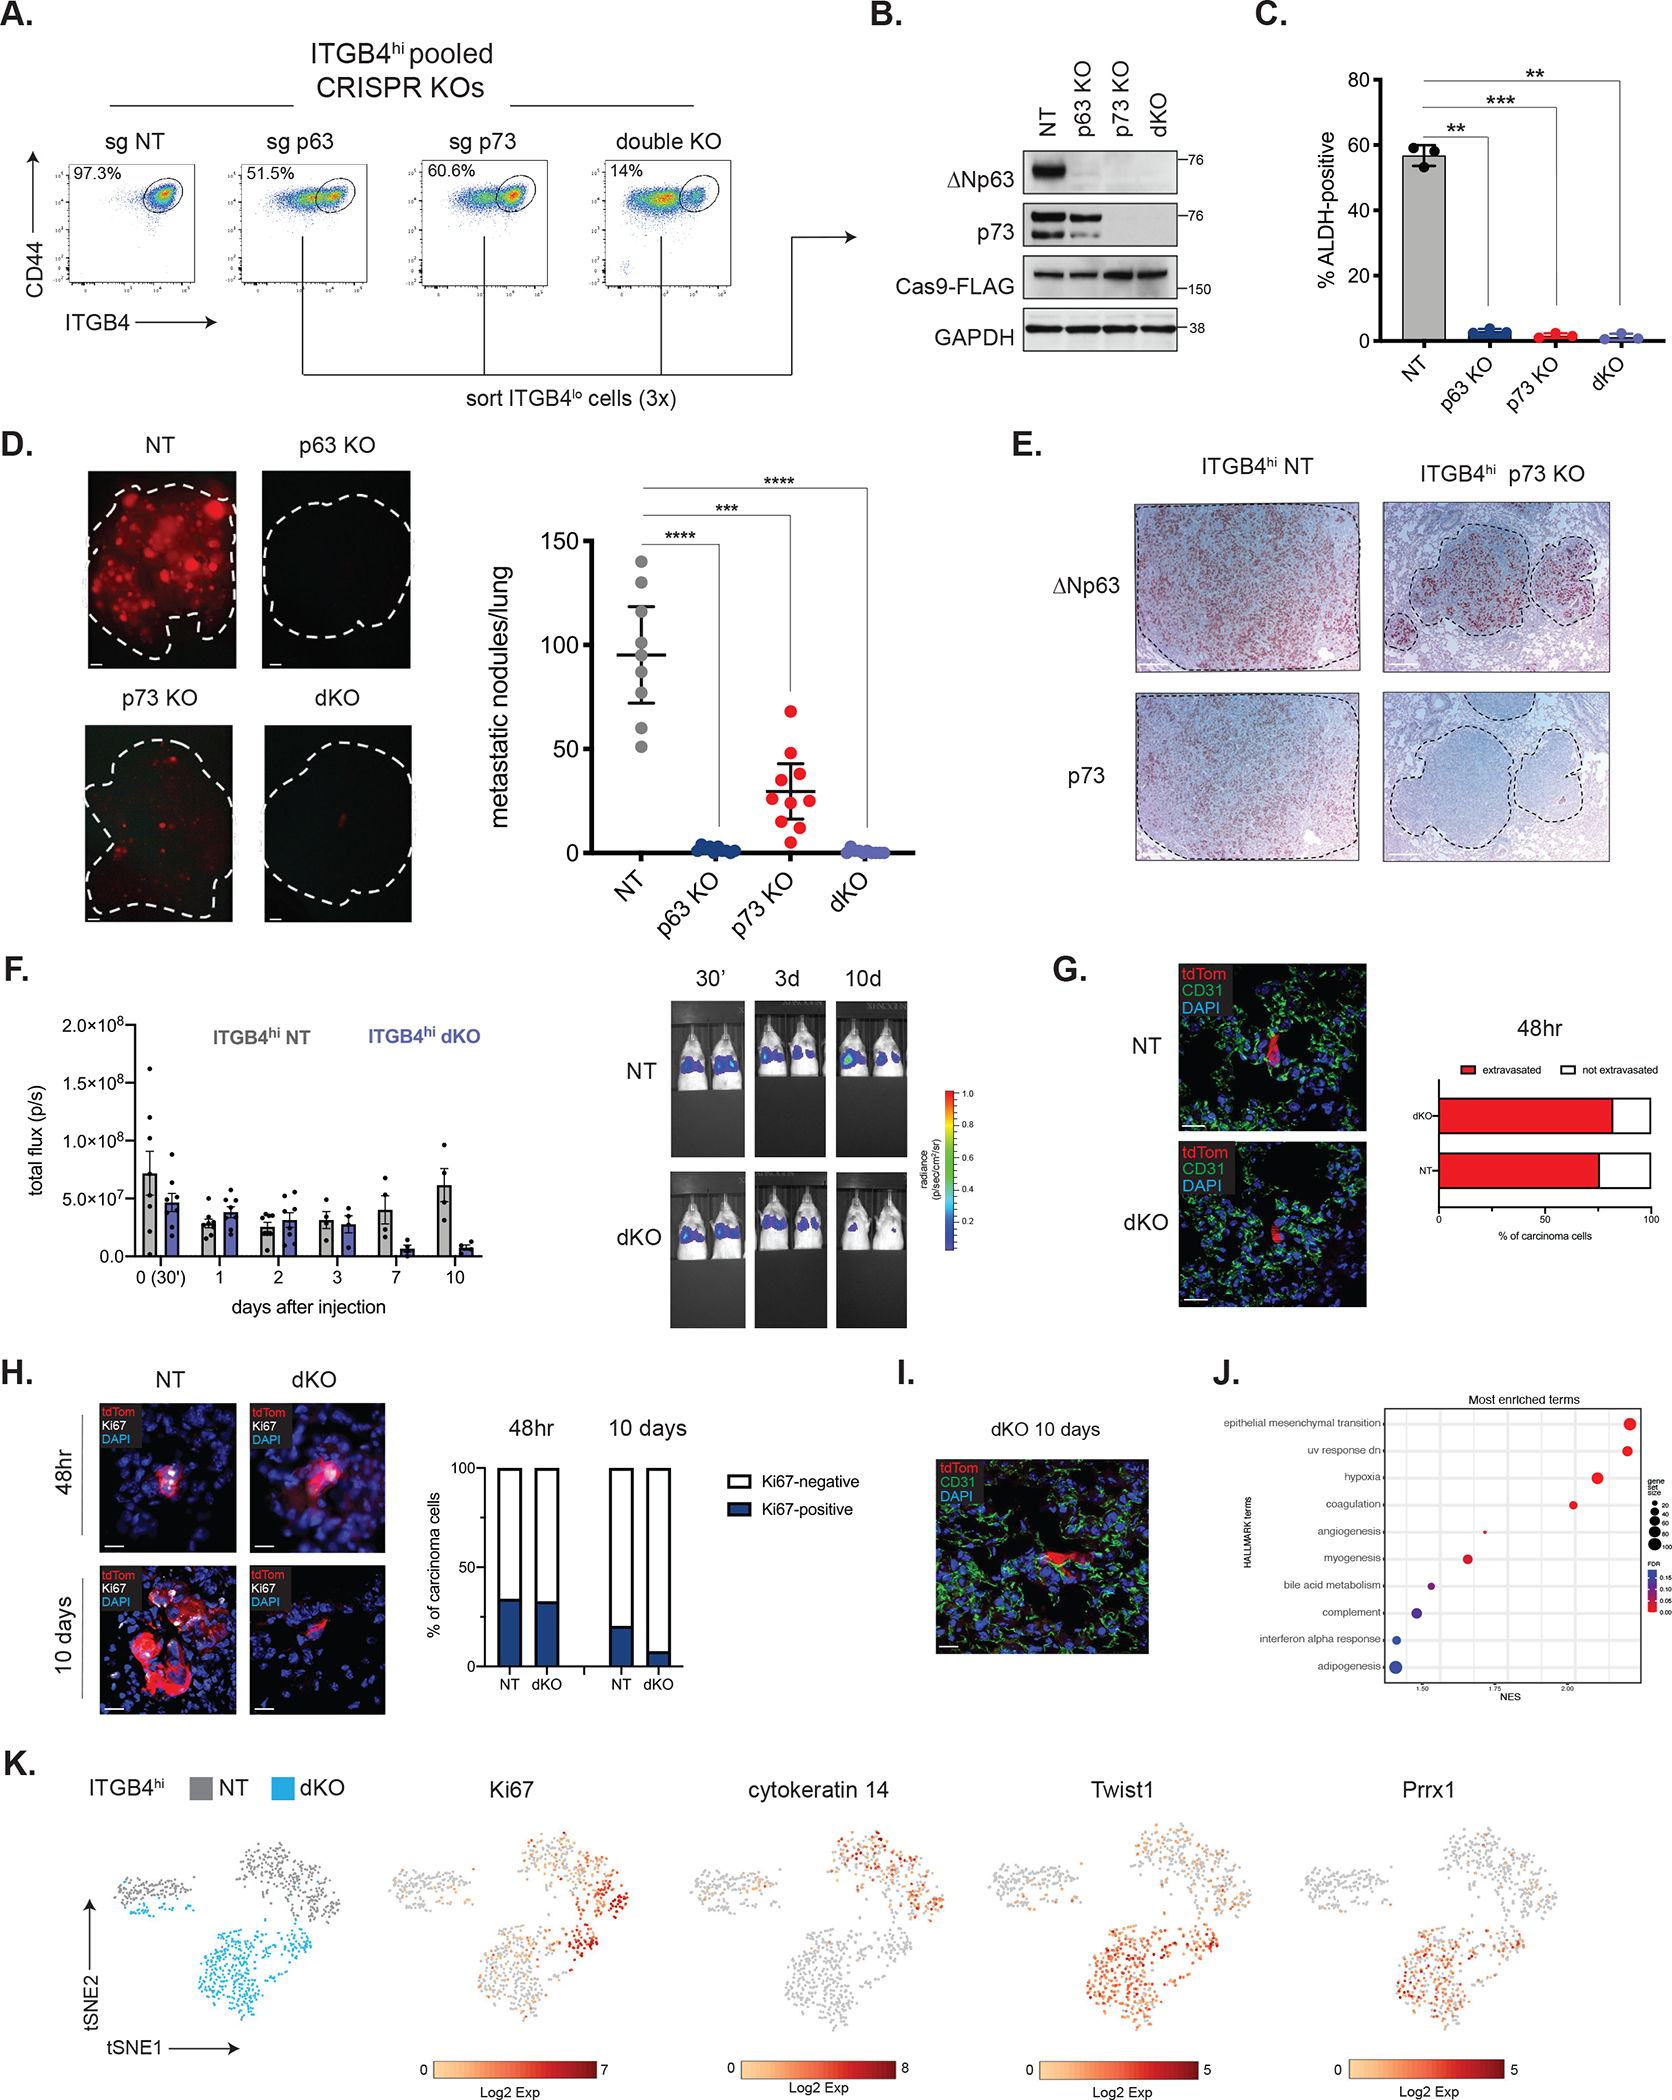
(A) Representative flow cytometry plots in the indicated ITGB4hi CRISPR-KO cells.
(B) Western blot analysis of the indicated proteins in control or KO cells that were successively sorted for loss of ITGB4 expression.
(C) Quantification of ALDH-positive cells in ITGB4hi control (NT) or KO cells. Data are ± SEM (n = 3), ** p ≤ 0.01, *** p ≤ 0.001.
(D) Metastatic colonization of ITGB4hi control or KO cells. Representative lung images (left) and quantification (right). Data are ± SEM (n = 10), *** p ≤ 0.001, **** p ≤ 0.0001. Scale bars, 1 mm.
(E) IHC staining for ΔNp63 and p73 in metastatic lung lesions. Scale bars, 100 μm.
(F) Quantification of luminescence after injection of ITGB4hi NT or dKO cells (n=8, days 0–2, n=4, days 3–10) and representative IVIS images (right).
(G) Representative IF staining for tdTom and CD31 in lung cryosections and quantification of extravasated ITGB4hi NT (n=29 cells from 2 mice) and dKO cells (n=28 cells from 2 mice) 48 hours after tail-vein injection (right). Scale bars, 20 μm.
(H) Representative IF staining for tdTom and Ki67 in lung cryosections and quantification of Ki67-positive cells 48 hours or 10 days after injection of ITGB4hi NT or dKO cells. 48hr: ITGB4hi NT (n=41 cells from 2 mice), dKO (n=79 cells from 2 mice). 10 days: ITGB4hi NT (n=166 cells from 2 mice), dKO (n=26 cells from 2 mice). Scale bars, 20 μm.
(I) Representative IF staining for tdTom and CD31 in lung cryosections 10 days after tail-vein injection of ITGB4hi dKO cells. Scale bar, 20 μm.
(J) GSEA of single-cell RNA-seq data comparing ITGB4hi NT and dKO cells isolated from the lungs of mice 3 days after tail-vein injection. Positive enrichment indicates higher expression in ITGB4hi dKO cells.
(K) t-SNE plot of tdTom-positive ITGB4hi NT and dKO cells isolated from the lungs.
Corresponding plots show expression of genes of interest.