
Figure 3. ΔNp63 regulates a distinct transcriptional program in CSCs and normal basal cells.
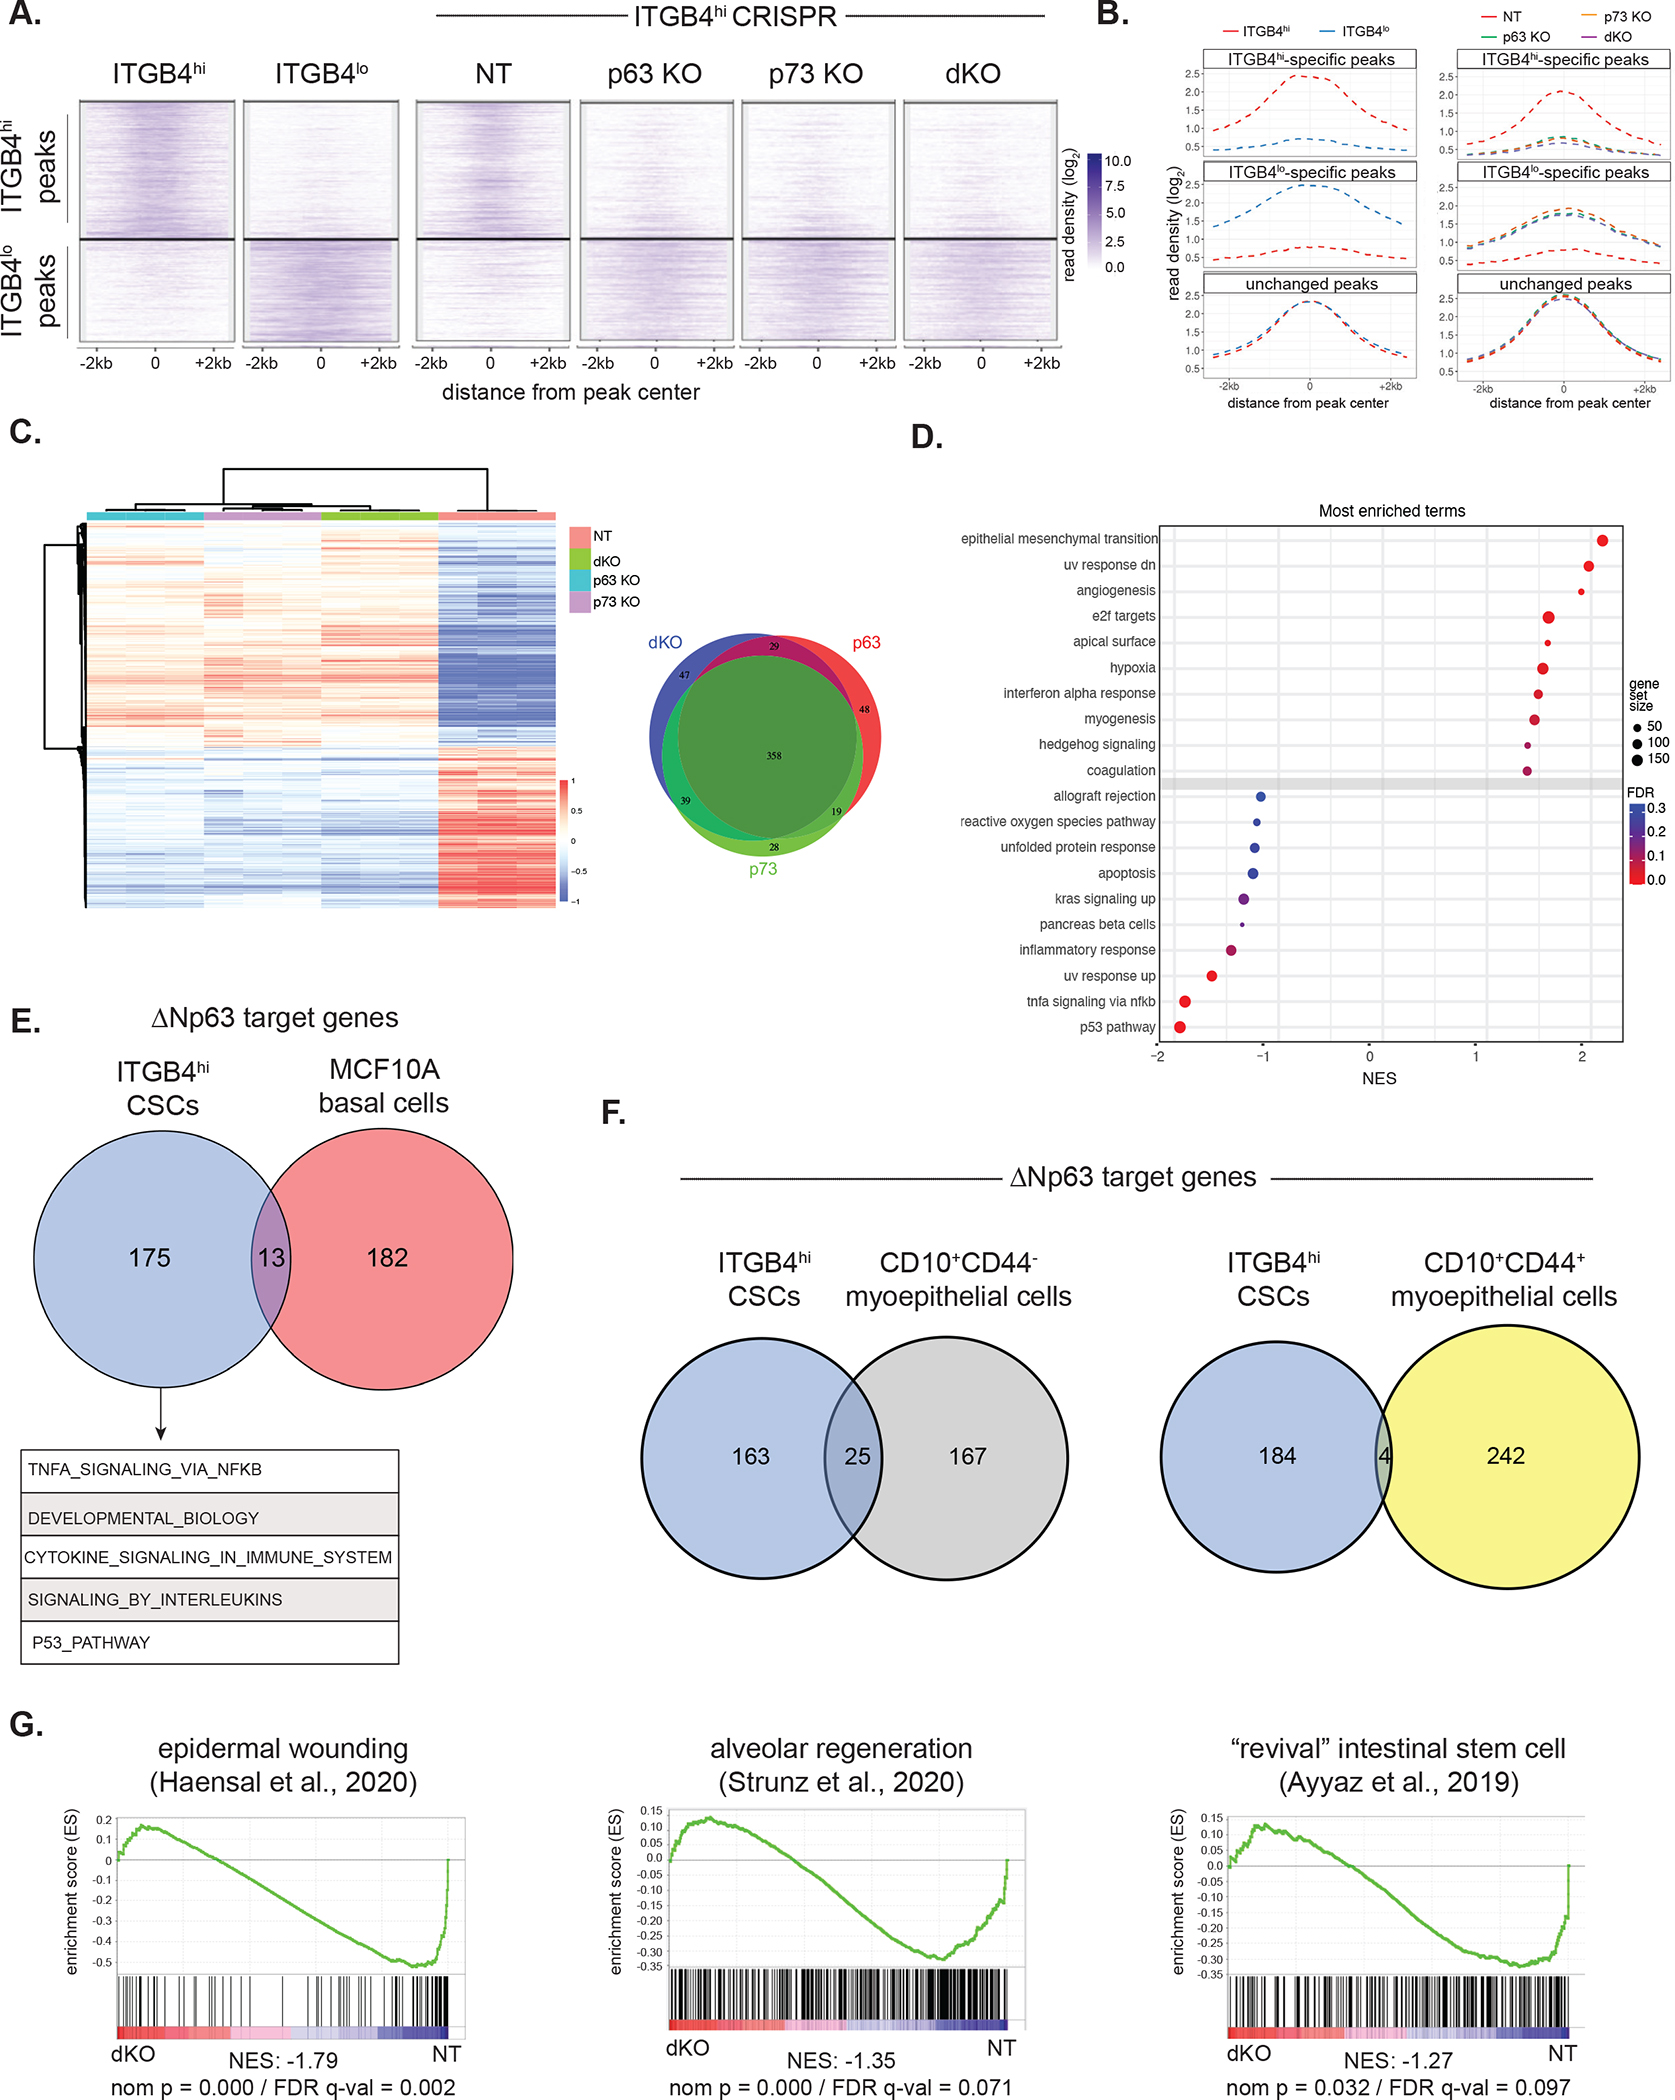
(A) Clustergram heatmap showing ITGB4hi- and ITGB4lo-specific H3K27ac ChIP-seq peaks (left) in the indicated ITGB4hi CRISPR KO cells (right).
(B) Metagene plot showing H3K27ac ChIP-seq reads in parental ITGB4lo and ITGB4hi cells (left) and ITGB4hi cells with the indicated CRSIPR KOs (right).
(C) Heatmap of the top differentially expressed genes (log2 fold-change ±1, p ≤ 0.01) in control (NT) ITGB4hi cells compared to the indicated KO lines (left). Venn diagram of genes downregulated across the three KO cell lines (right).
(D) GSEA based on RNA-seq data comparing ITGB4hi NT and dKO cells. Positive enrichment indicates higher expression in ITGB4hi dKO cells.
(E) Venn diagram showing ΔNp63 target genes in ITGB4hi cells and MCF10A cells 54. Top gene ontology (GO) terms of the ITGB4hi-specific ΔNp63 targets are shown below.
(F) Venn diagram showing ΔNp63 target genes in ITGB4hi cells and two subpopulations of CD10+ myoepithelial/basal 55.
(G) GSEA of RNA-seq data comparing ITGB4hi NT and dKO cells using the indicated epithelial wounding signatures.
See also Figure S4.