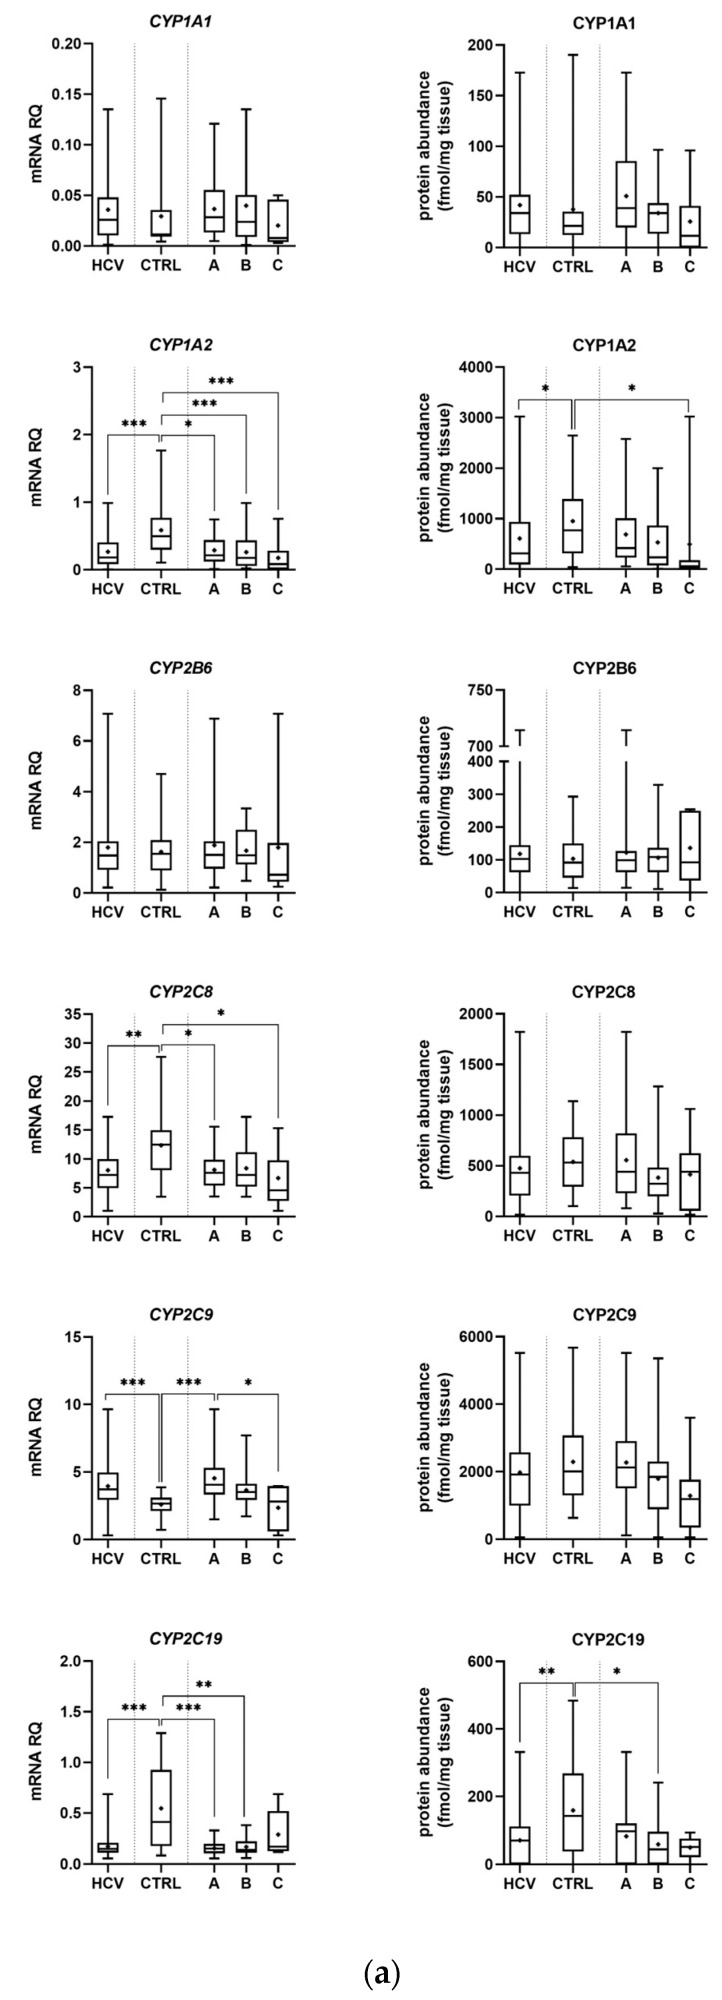
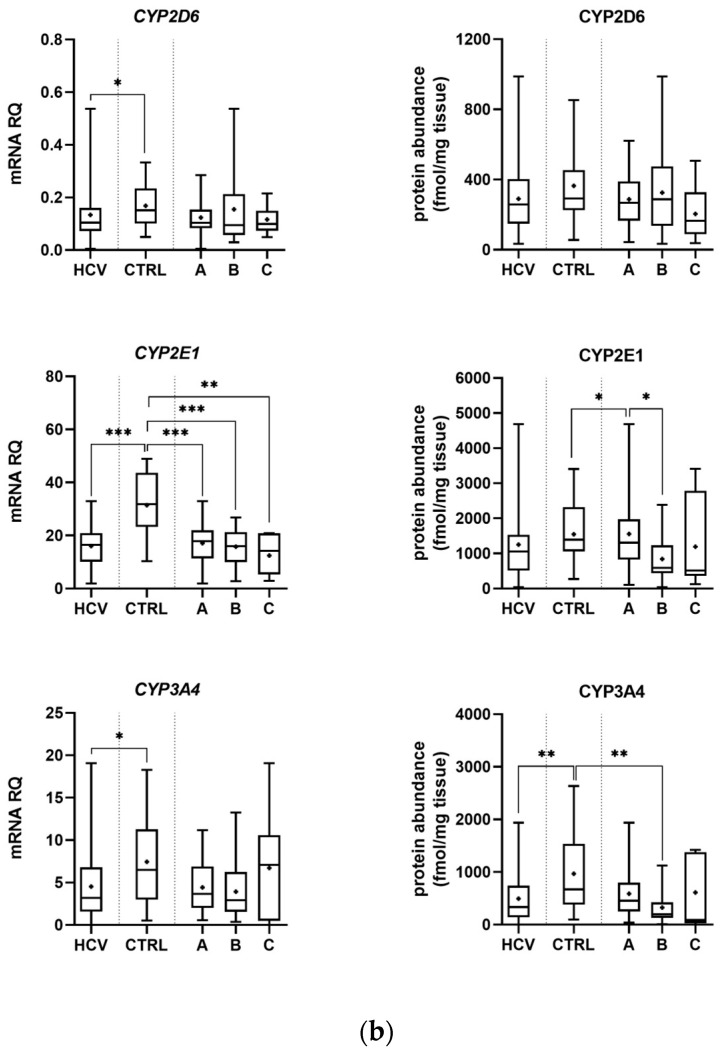
Figure 1.
Gene expression (left) and protein abundance (right) of CYPs in hepatitis C (HCV, n = 58) liver tissues stratified according to the Child–Pugh score into stages: A (n = 30), B (n = 21), and C (n = 7), and the controls (CTRL, n = 20). The data are represented as box-plots of the median (horizontal line), 75th (top of box) and 25th (bottom of box) quartiles, the smallest and largest values (whiskers) and mean (+). mRNA levels of the analyzed genes are expressed as relative amounts to the mean of five housekeeping genes (GAPDH, HMBS, PPIA, RPLP0, RPS9). Statistically significant differences: * p < 0.05, ** p < 0.01, *** p < 0.001 (Wilcoxon-signed rank test in comparison to the controls). (a) Results for CYP1A1, 1A2, 2B6, 2C8, 2C9 and 2C19. (b) Results for CYP2D6, 2E1 and 3A4.


