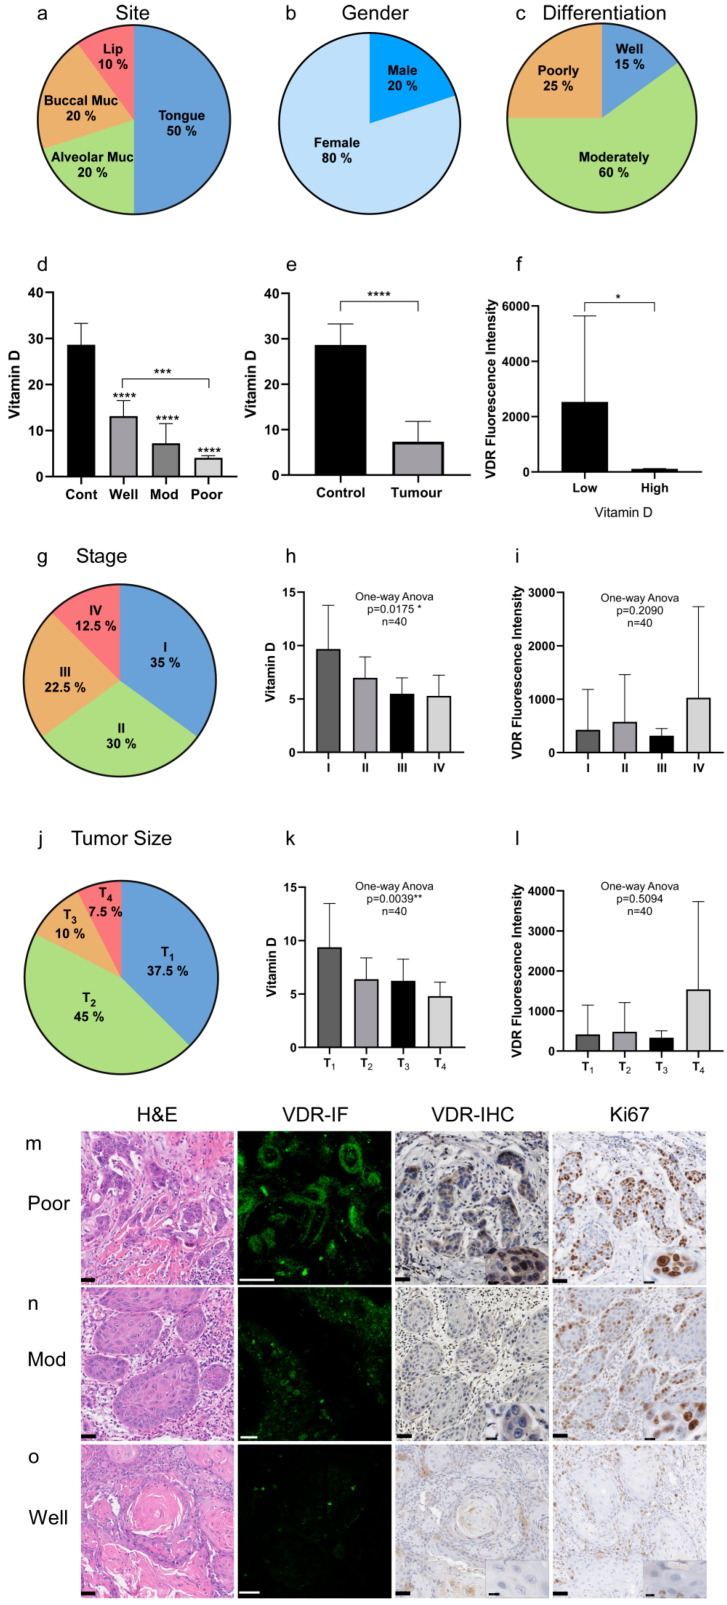
Figure 1.
VDR expression and VitD levels correlate with the HNC patients’ clinical parameters. (a–c) Clinical characteristics of the HNC patient cohort (n = 40): (a) tumor site, (b) gender, (c) tumor differentiation. (a) The most common tumor type in this cohort occurred in the tongue followed by alveolar and buccal mucosa, and the lips. (b) The male–female ratio was 1:4. (c) Most of the analyzed tumors were classified as moderately differentiated. (d–f) Quantification of the VitD serum levels and corresponding VDR expression. (d,e) VitD (25-hydroxyVitD3) serum levels were determined in all individuals of the cohort, revealing significantly lower VitD levels in the tumor patients compared to the healthy controls. Here, patients with poorly differentiated tumors showed the lowest VitD levels. (f) VDR expression was inversely correlated with the VitD serum levels. (g–i) Staging of the HNSCC cases according to UICC (8th edition). (g) The most common stage was S-I with 35%, followed by S-II (30%), and S-III and S-IV with 22.5% and 12.5%, respectively. (h,i) Quantification and correlation of the VitD serum levels (h) and corresponding VDR expression (i). (j–l) Tumor size classification of HNSCC cases according to UICC (8th edition). (j) The most common subtype was T1 followed by T2 with 45% and 37.5%, respectively. Only a few cases were classified as T3 (10%) and T4 (7.5%). (k,l) Quantification and correlation of the VitD serum levels (k) and corresponding VDR expression (l). (m–o) High VDR expression occurred in poorly differentiated, highly proliferative tumor tissues. Expression of VDR and Ki67 was determined by immunofluorescence (IF) and immunohistochemical (IHC) staining of the tumor biopsies classified as poorly (m), moderately (n), and well-differentiated (o). IF staining of VDR (green) was visualized by confocal laser scanning microscopy, and the intensity of fluorescence (mean area percent, MA%) was measured using ImageJ (shown in (f)). Cells at higher magnification are included in the IHC image overviews. Representative examples are shown. Tissues were stained with H&E and specific Abs as indicated. Scale bars, 50 µm/12.5 µm (magnifications). Statistical significance is represented in figures as follows: * p < 0.05, ** p < 0.01, *** p < 0.001, and **** p < 0.0001. A p value that was less than 0.05 was considered statistically significant.

