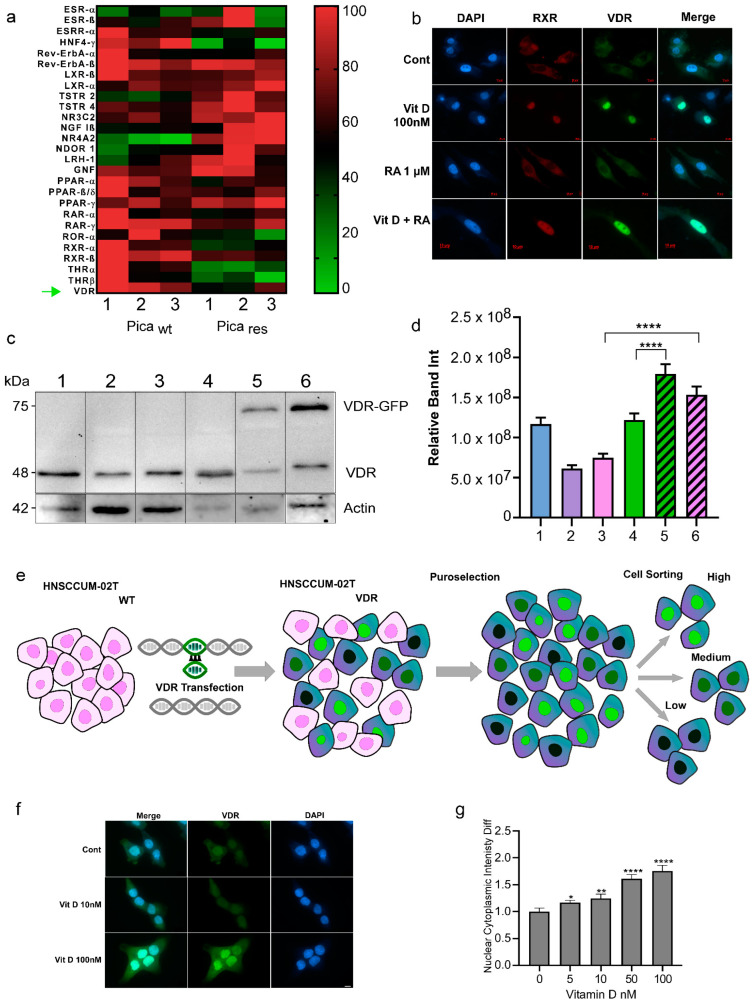
Figure 3.
Nuclear receptor profiling in the HNC cell models. (a) RNA-Seq transcriptomics and heat map analysis illustrated that the expression of nuclear receptors is altered in therapy-resistant (res) versus sensitive (WT) Pica cells. A set of nuclear receptors were analyzed: Estrogen receptor-ß (ESR-ß), estrogen-related receptor-a (ESRR-α), hepatocyte nuclear factor-4-α (HNF4-α), rev-ErbAα, rev-ErbAß, liver X receptor-ß (LXR-ß), liver X receptor-α (LXR-α), testicular receptor 2 (TSTR 2), testicular receptor 4 (TSTR 4), mineralocorticoid receptor (NR3C2), nerve growth factor Iß (NGF Iß), Nuclear Receptor Subfamily 4 Group A Member 2 (NR4A2), neuron-derived orphan receptor 1 (NDOR 1), liver receptor homolog-1 (LRH-1), germ cell nuclear factor (GNF), peroxisome proliferator-activated receptor-α (PPAR-α), peroxisome proliferator-activated receptor-ß/δ (PPAR-ß/δ), retinoic acid receptor-α (RAR-α), retinoic acid receptor-γ (RAR-γ), RAR-related orphan receptor-α (ROR-α), retinoid X receptor-α (RXR-α), retinoid X receptor-ß (RXR-ß), thyroid hormone receptor-α (THR-α), and VitD receptor (VDR) ‘’green arrow’’. Heat map visualizes the expression levels of differentially expressed genes in WT vs. resistant cells (green: downregulated, red: upregulated). (b) Fluorescence microscopy to visualize VDR or RXR expression and activation/translocation in HNC cells. Cells were treated with 100 nM VitD, 1 µM retinoic acid (RA), or a combination of both (VitD + RA), for 30 min and fixed. Cells were stained with specific fluorescent VDR Ab (green), RXR Ab (red), and nuclei marked with Hoechst (blue). Scale bar, 10 µm. (c,d) Immunoblot quantification of endogenous VDR expression in the wt HNC cell lines (1-SCC-4, 2-HNCUM-01T, 3-HNCUM-02T, and 4-FaDu) as well as the VDR-GFP transfected, overexpressing cell lines (5-FaDu VDR, and 6-HNCUM-02T-VDR). Actin served as a loading control. (d) Relative protein quantification of the Western blot. (e) Generation of VDR-overexpressing HNC cell models. HNCUM-02T cells were transfected with VDR C-terminally fused to GFP (green). Positive clones were selected using puromycin and sorted by FACS into high, medium, and low subpopulations. Low-expressing subpopulations were used for the experiments. (f) Fluorescence microscopy visualized VitD-induced expression and nuclear translocation of VDR in HNC (HNCUM-02T) cells. Scale bar, 10 µm. Cells were treated with 10 or 100 nM VitD for 30 min, fixed and nuclei were stained with Hoechst (blue). (g) VDR translocation was automatically quantified by high-throughput microscopy and normalized to the untreated controls. Statistical analysis of the nucleus-to-cytoplasm ratio (N/C) revealed a significantly increased N/C ratio in the presence of VitD compared to the untreated controls, indicating a cytoplasm-to-nuclear translocation. Statistical significance is represented in figures as follows: * p < 0.05, ** p < 0.01, and **** p < 0.0001. A p value that was less than 0.05 was considered statistically significant.

