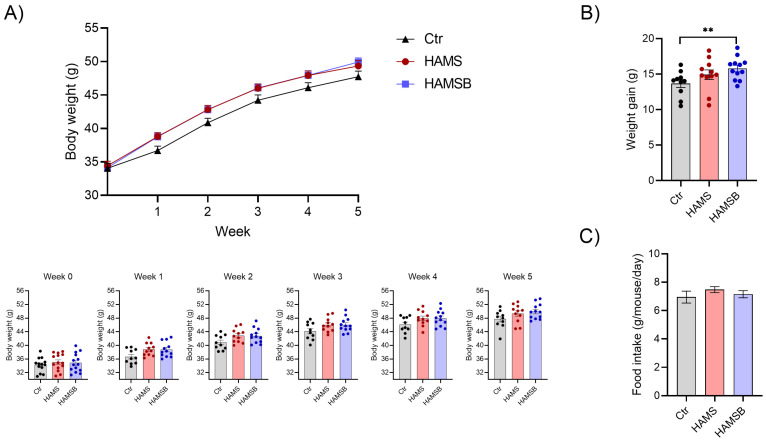
Figure 3.
Bodyweight and food intake. (A) Weekly measurements of body weight in db/db mice fed a control diet or a diet supplemented with either HAMS or HAMSB. Body weight for each individual mouse in the different weeks are shown below the weight curve. (B) Total weight gain at the end of the 5-week feeding period. (C) Food intake is shown as gram per mouse per day. Bars show the mean ± SEM. ** p < 0.01. Each circle represents an individual mouse.

