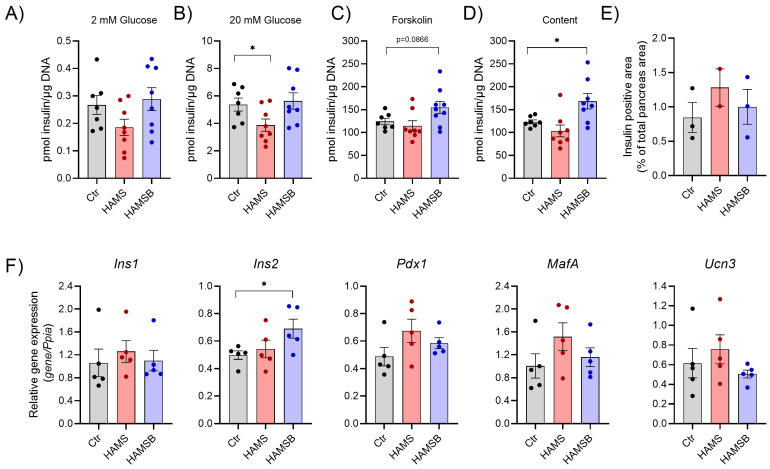
Figure 5.
Islet function and gene expression. Insulin secretion was measured from islets of db/db mice fed three different diets: Ctr, HAMS or HAMSB for 5 weeks. The day after islet isolation, insulin secretion was measured by static batch incubations in response to 2 mM glucose (A), 20 mM glucose (B) and 20 µM forskolin with 20 mM glucose, and normalized to DNA (C). (D) Insulin content measured post-assay. (E) Beta-cell area was detected by immunohistochemistry and shown as the insulin-positive area, as a percentage of the total pancreas area. (F) Gene expression was determined by RT-qPCR in pancreatic islets cultured overnight. Total RNA was extracted from a pool of islets from 1–5 mice on the same diet. Relative mRNA abundances of the insulin genes: insulin 1 (Ins1) and insulin 2 (Ins2) and beta-cell identity genes: pancreatic and duodenal homeobox 1 (Pdx1), MAF bZIP transcription factor A (MafA) and urocortin3 (Ucn3) are shown. Data are normalized to the reference gene peptidylprolyl isomerase A (Ppia). Bars show the mean ± SEM. * p < 0.05. Each circle represents pools of islets from mice.

