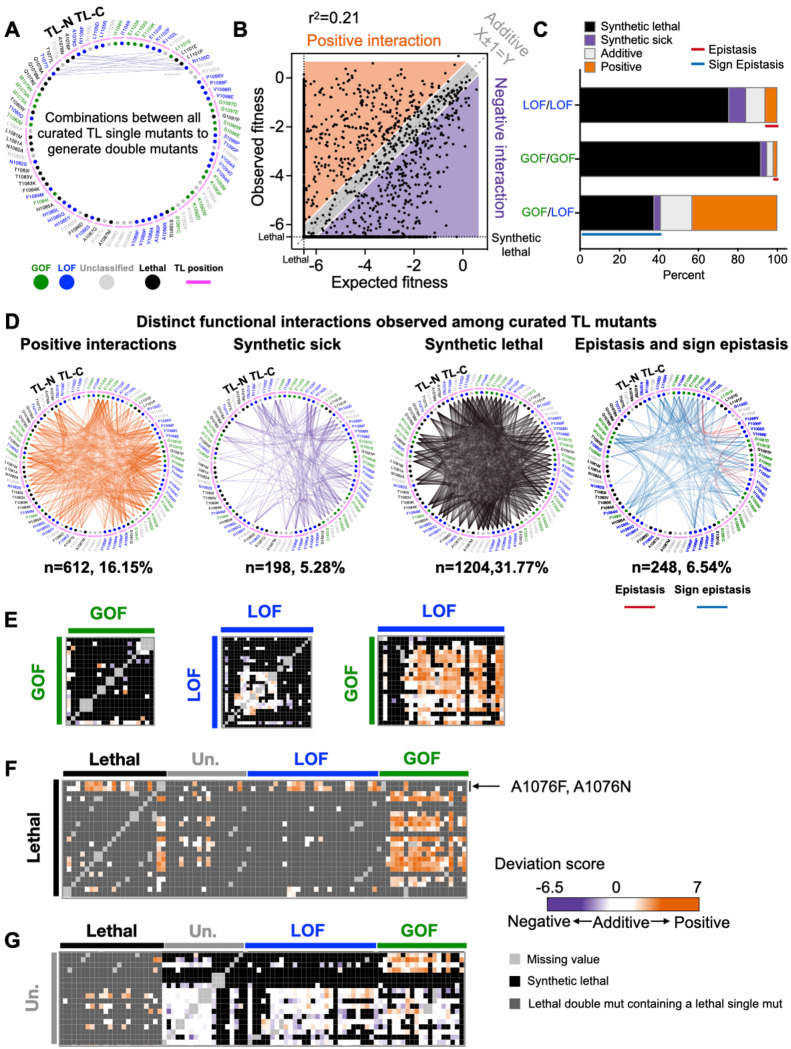
Figure 2. Widespread epistasis in the Pol II TL interaction landscape.
A. Design of the pairwise double mutant library. We curated 2–4 substitutions for each TL residue (in total 90 substitutions, n(GOF) = 18, n(LOF) = 30, n(Unclassified) = 19, n(Lethal) = 23), and combined them with each other to generate double mutants. 3910 double mutants representing combinations between any two TL residues were measured and 3790 of them passed the reproducibility filter. WT TL residue positions are indicated with magenta arch. Phenotype classes of single substitutions are shown as colored circles (GOF in green, LOF in blue) while unclassified mutants are in grey and lethal mutants are in black. B. An xy-plot of observed double mutant growth fitness measured in our experiment (Y-axis) and expected fitness from the addition of two constituent single mutants’ fitnesses (X-axis). N (positive) = 612. N (Negative) = 1402. N (Additive) = 1776. N (Sum)=3790. Lethal threshold (−6.5) is labeled with dotted lines on X and Y axis. The additive line where X ± 1 =Y is indicated with dashed line. Simple linear regression was performed, and the best fit equation is Y = 0.52X −2.55, r2 = 0.21, P < 0.0001. C. Percent of interactions observed from each combination group. N (LOF/LOF) = 412. N (GOF/GOF) = 156. N (GOF/LOF) = 534. Epistasis and sign epistasis are indicated with colored lines. D. Various groups of interactions are displayed in network format. E-G. The intra-TL functional interaction heatmaps of various combinations. Double mutant deviation scores are shown in the heatmap. Annotations at the top and left indicate the curated single mutants and their predicted phenotypic classes from multiple logistic regression modeling. GOF/GOF, LOF/LOF, and GOF/LOF combinations are shown in E. Combinations with lethal single substitutions are in F. Combinations with unclassified mutants are in G.

