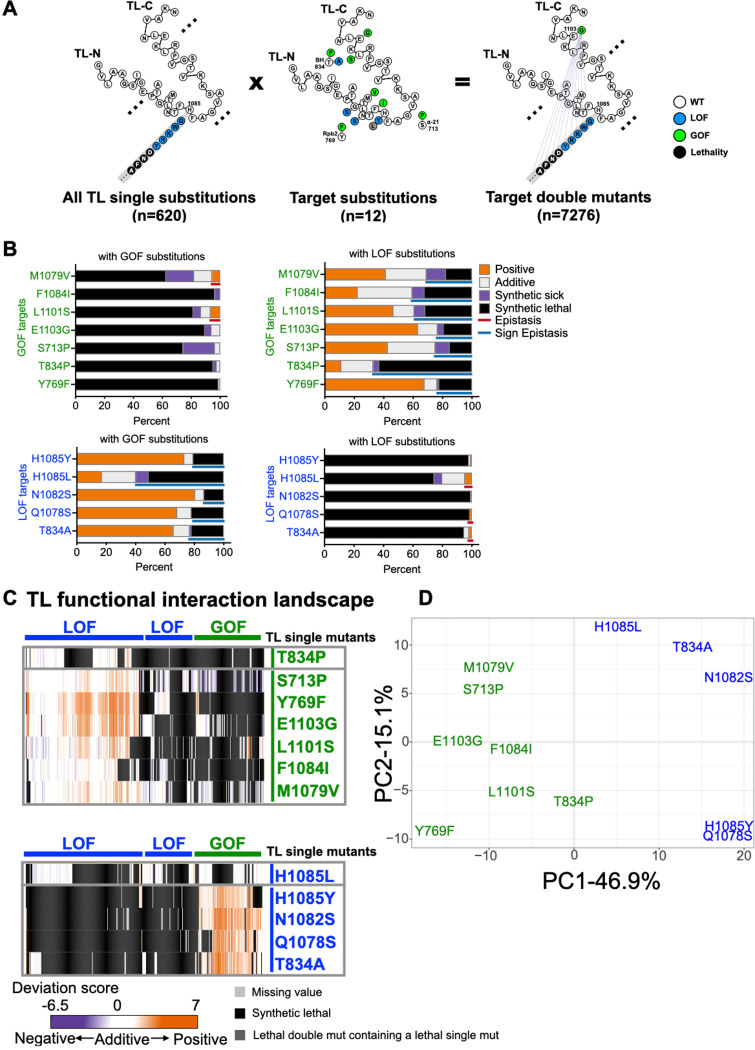
Figure 3. Pol II TL interaction landscape distinguishes mutants with similar phenotypes.
A. Design of the targeted double mutant libraries. All possible substitutions at each TL residue (represented with a simplified format in the left panel) and twelve “probe” mutations (eight within the TL and four in TL-proximal domains) (middle panel) were combined with to generate 7280 double mutants (right panel). 7276 mutants passed the reproducibility filter and were used for interaction analyses. B. The percentage of functional interactions observed for each probe mutant with viable GOF or LOF TL substitutions. Epistasis and sign epistasis are labeled with colored lines. C. Pol II-TL functional interaction landscape with interactions represented by deviation scores. The upper panel shows interactions of GOF probe mutants in combination of viable GOF or LOF TL substitutions. The lower panel shows interactions of combinations with LOF probe mutants. D. Principal component analysis (PCA) of deviation scores across double mutant interactions for 12 probe mutants (see Methods).

