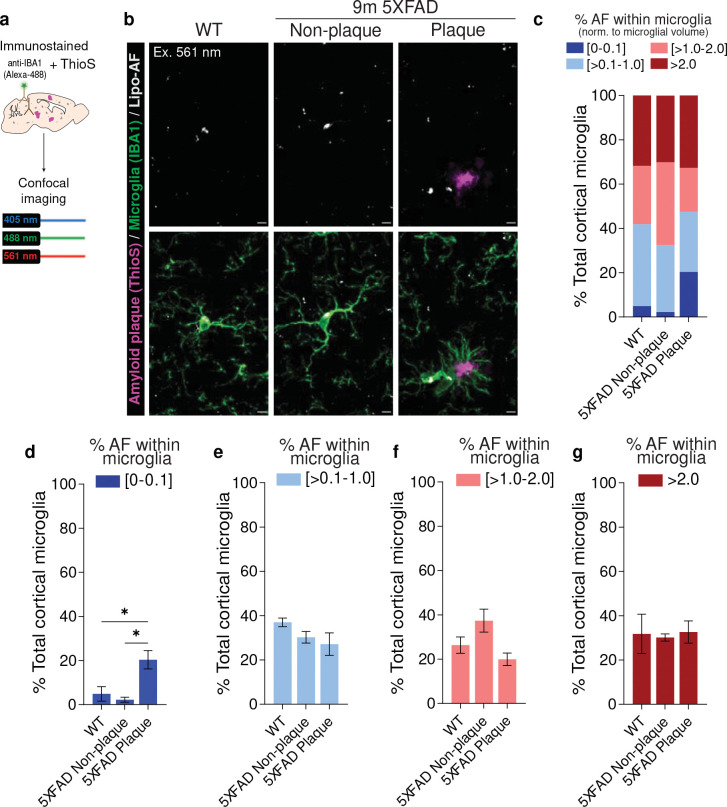
Figure 2. Microglial accumulation of lipo-AF signal is not exacerbated in a mouse model of neurodegeneration.
a Methods for assessing lipo-AF in microglia in the 5XFAD mouse model. b Representative images of anti-IBA1 immunolabelled microglia (green), Thioflavin S labeled amyloid plaques (ThioS, magenta), and lipo-AF (white) in the somatosensory cortex of 9-month-old 5XFAD mice and wild-type (WT) littermates. The lipo-AF was excited by a 561 nm laser. Scale bars = 5 μm. c Quantification of the percentage of cortical microglial with [0–0.1]% (dark blue), [>0.1–1.0]% (light blue), [>1.0–2.0]% (pink), or >2.0% (dark red) of their total volume occupied by AF. Data are represented as the mean, n = 3 mice. d-g Same data as c, but each bin is graphed separately. Data are represented as mean ± SEM. One-way ANOVA with Tukey multiple comparisons test (d, F = 9.74, df = 8; e, F = 2.095, df = 8; f, F = 4.813, df = 8; g, F =0.04357, df = 8); *p<0.05.

