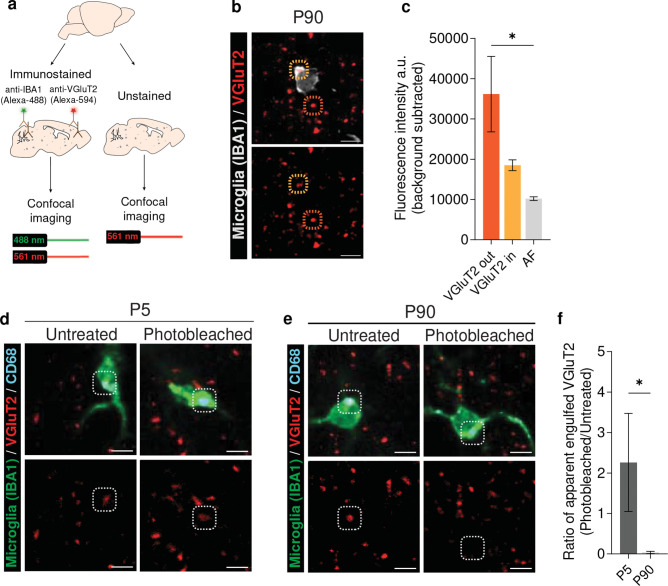
Figure 4. Use of the photobleaching method to determine the degree to which lipo-AF signal can confound analysis of engulfed synaptic material within microglia.
a P90 mouse brain sections were immunolabeled with anti-VGluT2 antibody and secondary antibodies conjugated with Alexa-Fluor 594. Microglia were also co-immunolabeled with anti-IBA1. Adjacent sections were left unstained to image AF. b Representative images of anti-VGluT2+ presynaptic terminals within the P90 somatosensory cortex immunolabelled with Alexa-Fluor 594 secondary antibody. The dashed orange circles highlight the anti-VGluT2 signal outside microglia. The dashed yellow circles highlight the anti-VGluT2 signal inside microglia. Bottom image is the same image without the anti-IBA1 immunostaining. Scale bars = 5 μm. c Quantification of the fluorescence intensity of Alexa-Fluor 594 immunolabelled VGluT2+ puncta, outside (orange bar) and inside microglia (yellow bar) upon excitation with a 561 nm laser line. For comparison, lipo-AF signal intensity (gray bar), upon excitation with a 561 nm laser line, in adjacent tissue sections was also quantified. Data are represented as a mean ± SEM, n = 3 mice. One-way ANOVA with Tukey multiple comparisons test (F = 5.873, df = 8); *p<0.05. d-e Representative images of signal in the anti-VGluT2+ immunolabeled channel (red) inside anti-CD68+ lysosomes (cyan) of anti-IBA1 immunolabelled microglia (green) in untreated (left) or photobleached samples (right) from P5 (d) or P90 (e) mouse cortex. White dotted circles highlight signal within the anti-VGluT2 channel that co-localize with microglial C68+ lysosomes. Bottom images in d and e are the same images as the top images without the anti-IBA1 immunostaining. Scale bars = 5 μm. f The ratio of the volume of apparent engulfed anti-VGluT2+ material within microglia from the P5 and P90 mouse cortex post-photobleaching to pre-photobleaching (volume of anti-VGluT2 signal within microglia post-photobleaching/pre-photobleaching signal). Data are represented as a mean ± SEM, n = 4 mice. Two-tailed Mann-Whitney t-test; *p<0.05.

