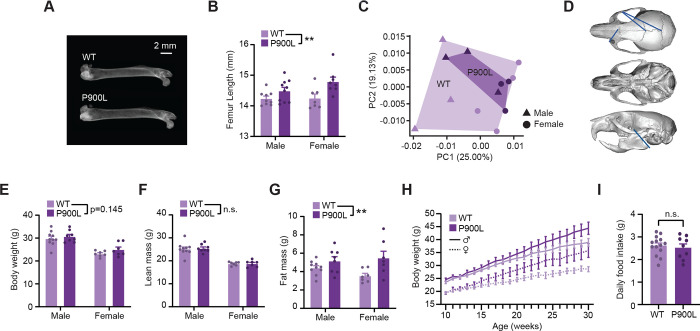
Figure 1: P900L mutants have increases in bone length and progressive obesity.
(A) Representative dual x-ray image of femurs isolated from 30-week WT and P900L littermates.
(B) Quantification of femur length (P900L n=18, 10 male, 8 female; WT n=16, 9 male, 7 female; 2-way ANOVA, genotype ** p<0.01).
(C) Principal components analysis of skull landmark distances (P900L n=8, 4 male, 4 female; WT n=8, 4 male, 4 female).
(D) Example image of reconstructed skull from μCT imaging with significant linear distances shown. Blue lines indicate distances that were significantly longer in the WT compared to the P900L, and no distances were significantly longer in the P900L.
(E-G) Quantification of body weight (E) and EchoMRI measures of lean mass (F) and fat mass (G) (P900L n=15, 8 male, 7 female; WT n=17, 10 male, 7 female; 2-way ANOVA, genotype ** p<0.01).
(H) Body weights of animals on a high-fat diet measured weekly for 20 weeks (P900L n=18, 10 male, 8 female; WT n=16, 9 male, 7 female; 3-way repeated measures ANOVA; genotype p=0.022; genotype by time p<0.0001)
(I) Daily food intake between 30-week WT and P900L animals that had been on a high fat diet for 20 weeks is not significantly changed (P900L n=9, 3 male, 6 female; WT n=14, 7 male, 7 female; Unpaired T-Test p=0.624).
Results are expressed as mean ± SEM. No significant sex-genotype interactions observed.

