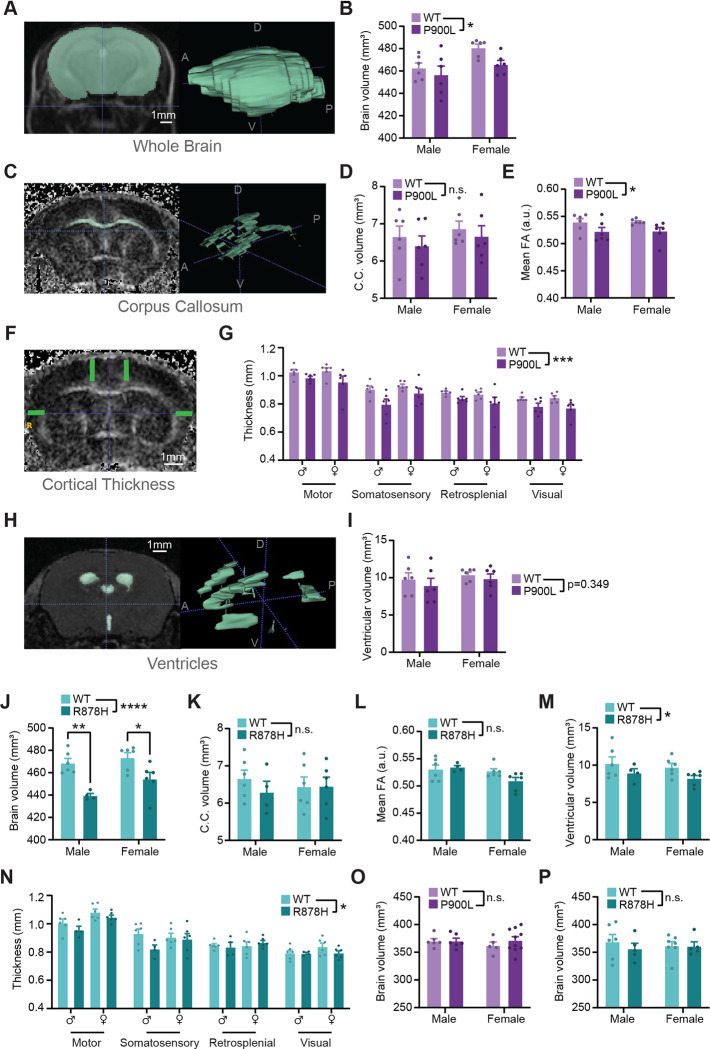
Figure 2: DNMT3A mutations cause reductions in brain volume and cortical thickness.
(A) Representative MRI image (left) and whole brain segmentation (right). D-Dorsal, V-Ventral, A-Anterior, P-Posterior.
(B) Quantification of whole brain volume from WT and P900L adults.
(C) Representative MRI image of fractional anisotropy (FA) of corpus callosum (left) and example segmentation (right).
(D-E) Quantification of corpus callosum volume (D) and FA (E) in WT and P900L animals.
(F) Representative image of cortical thickness measurements.
(G) Quantification of cortical thickness across various regions (3-way repeated measures ANOVA, genotype p<0.0001, region p<0.0001).
(H) Representative image of ventricles from an ADC image (left), and example segmentation (right).
(I) Quantification of ventricular volume in WT and P900L animals.
(J-N) Quantification of WT and R878H whole brain volume (J), corpus callosum volume (K) and FA (L), ventricular volume (M) and cortical thickness (N) (Cortical thickness: 3-way repeated-measures ANOVA, genotype p<0.05, region p<0.0001).
(O-P) Brain volume measurements at P10 shows no significant difference between P900L mutants (O) or R878H mutants (P) and their WT littermates.
Results are expressed as mean ± SEM with individual animals shown. Genotype effect from 2-way ANOVA and significant within-sex comparisons with Sidak’s multiple testing correction are shown. As some measures showed a significant sex-effect, sexes were separated, and sex is included as a factor. Detailed statistics, and sample sizes in Supplemental Table 1. * p<0.05; ** p<0.01; *** p<0.001; **** p<0.0001

