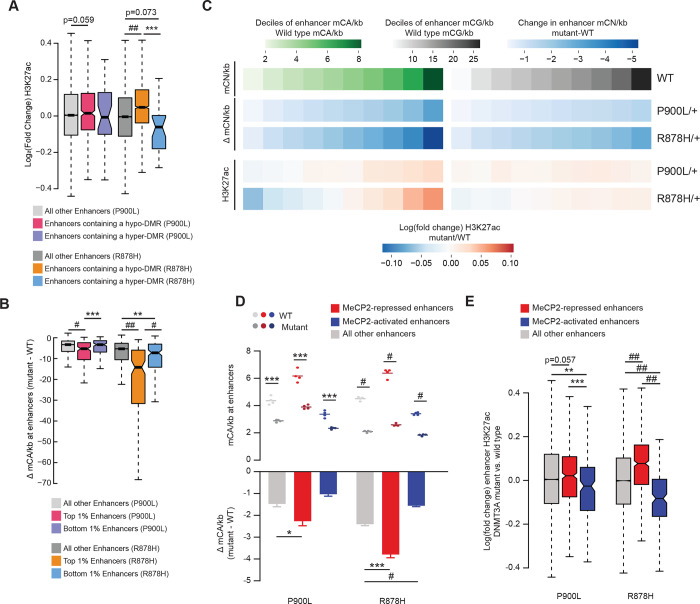
Figure 5: Methylation changes in DNMT3A mutants disrupt enhancer activity.
(A) Log2 fold changes of H3K27ac at enhancers containing DMRs called in that mutant.
(B) Change in mCA/kb (mutant – WT) for the top and bottom 1% of enhancers. The most significantly upregulated and downregulated enhancers were called between WT and mutants, and the average methylation loss at those enhancers was measured.
(C) Genome-wide deciles of WT mCA or mCG sites per kilobase at enhancers, and the loss of methylation and fold change in H3K27ac at these sites in both P900L and R878H mutants.
(D) Mean mCA sites per kilobase in DNMT3A mutants and their WT littermates (top), and the change in mCA sites per kilobase between mutants and WT littermates (bottom) at enhancers significantly dysregulated in MeCP2 mutants (Clemens et al., 2019).
(E) Log2 fold changes in H3K27ac between mutants and WT littermates at enhancers significantly dysregulated in MeCP2 mutants (Clemens et al., 2019).
Bar graphs indicate mean ± SEM. Notched box and whisker plots indicate median, interquartile, and confidence interval of median. All groups n=4, 2 male, 2 female. Detailed statistics, and sample sizes in Supplemental Table 1. * p<0.05; ** p<0.01; *** p<0.001; # p<0.0001; ## p<2 e−10

