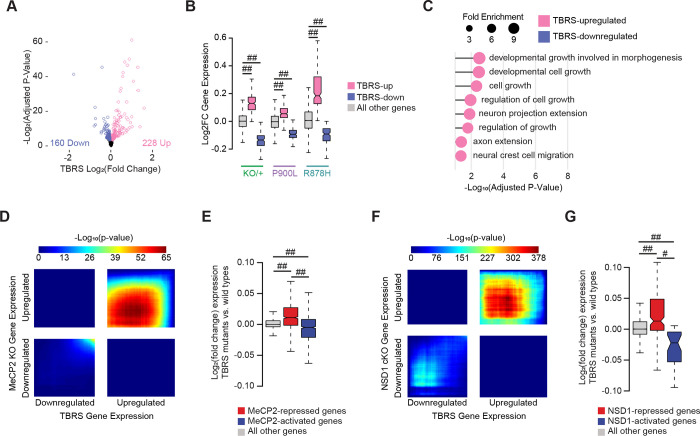
Figure 7: Shared transcriptional changes across DNMT3A mutants indicate disruption of growth and synaptic processes.
(A) Volcano plot of DESeq2 log2 fold changes from DNMT3A mutant vs. WT littermate analysis between littermate paired data from DNMT3AKO/+ (Christian et al., 2020), DNMT3AR878H/+, and DNMT3AP900L/+ datasets (design = ~ pair + group; contrast by group). Genes reaching a significance of padj<0.1 are indicated in blue and pink.
(B) Log2 fold changes of gene expression within each mutant (KO/+, P900L, and R878H) of genes defined as differentially expressed in the combined TBRS-mutant analysis.
(C) Most significant PANTHER gene ontology (biological process) terms enriched in the TBRS differentially expressed gene lists. No significant terms were identified in the TBRS-downregulated gene list.
(D) Rank-rank hypergeometric overlap (RRHO) of transcriptome-wide gene expression changes in the cerebral cortex of TBRS mutants versus MeCP2 KO mice (Clemens et al., 2019).
(E) Log2 fold changes in the TBRS mutants at genes significantly disrupted in MeCP2 mutants (Clemens et al., 2019).
(F) RRHO of transcriptome-wide gene expression changes in the cerebral cortex of TBRS mutants versus NSD1 conditional KO mice (Hamagami et al., 2023).
(G) Log2 fold changes in the TBRS mutants at genes significantly disrupted in NSD1 cKO cortices (Hamagami et al., 2023).
Notched box and whisker plots indicate median, interquartile, and confidence interval of median with significance from Wilcox Rank Sum test shown. Detailed statistics, and sample sizes in Supplemental Table 1. # p<0.0001; ## p<2 e−10

