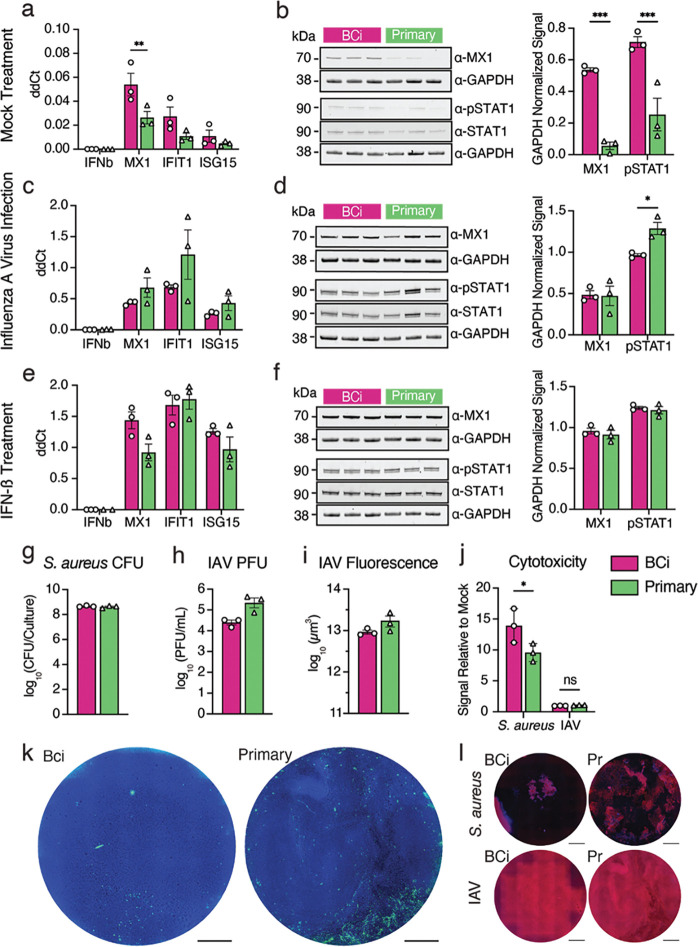
Fig. 4: Infection of BCi-NS1.1- and primary-derived HAE cultures with IAV and S. aureus.
a, c, e. RNA levels of MX1, IFN-b, IFIT1 and ISG15 were measured using RT-qPCR at steady-state (a), after IAV infection (c) and after IFN- b treatment. b, d, f. Representative western blots for MX1 and phosphorylated STAT1 (p-STAT1), along with GAPDH controls for mock treated (b), influenza A virus (IAV)-infected (d) and IFN-b-treated (f) cultures, and quantification of western blot band intensity from three individual blots for each condition. g. S. aureus colony-forming units (CFU) after 18h of infection h. IAV plaque-forming units (PFU) after 24h of infection i. influenza A virus-infected cultures were fixed and stained with an antibody against influenza virus-NP, then infection was quantified as total NP positive area. j. LDH release was quantified after influenza A virus or S. aureus infection and plotted as a fold change of LDH release over mock infected cultures. k. Top-down images of representative IAV-infected HAE cultures, showing DAPI (blue) and influenza virus-NP (green). Scale bars = 1mm. l. Top-down images of representative S. aureus and IAV-infected HAE cultures, showing Phalloidin (red) and DAPI (blue). Scale bars = 1mm.

