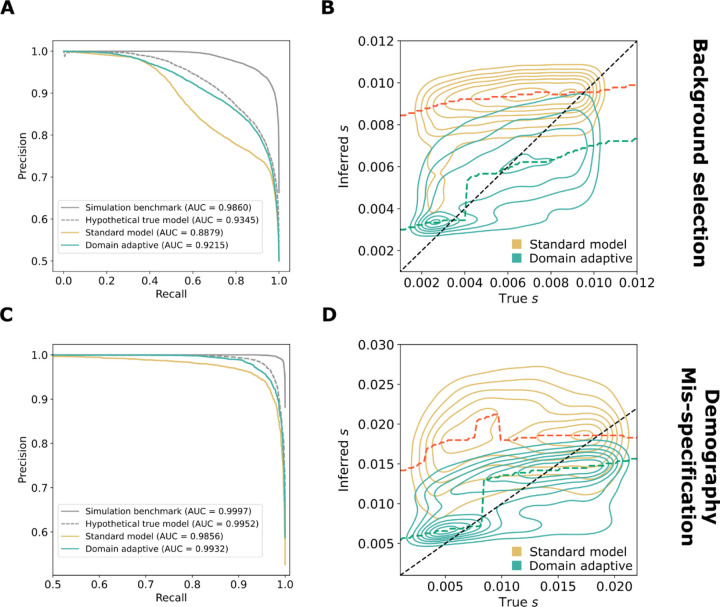
Figure 3. Performance of domain-adaptive SIA models.
Results are shown from (A, B) the background-selection and (C, D) the demography-mis-specification experiments. (A, C) Precision-recall curves for sweep classification. (B, D) Contour plots summarizing true (horizontal axis) vs. inferred (vertical axis) selection coefficients (s) for the standard (gold) and domain adaptive (turquoise) models as evaluated on the held-out test dataset. The ridge along the horizontal axis of each contour is traced by a dashed line, representing the mode of the inferred value for each true value of s. Raw data underlying the contour plots are presented in Fig. S2. See Fig. 1C for definition of the model labels.

