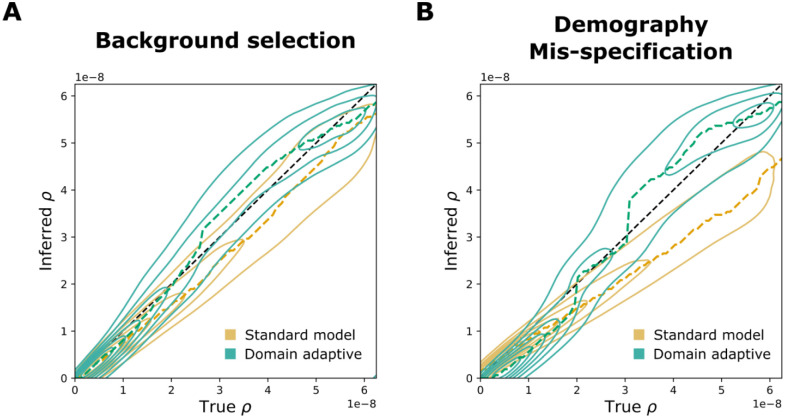
Figure 4. Performance of domain-adaptive ReLERNN models.
Results are shown from (A) the background-selection and (B) the demography-mis-specification experiments. Each contour plot summarizes true (horizontal axis) vs. inferred (vertical axis) recombination rates (ρ) for the standard (gold) and domain adaptive (turquoise) models as evaluated on the held-out test dataset. The ridge along the horizontal axis of each contour is traced by a dashed line, representing the mode of the inferred value for each true value of ρ. Raw data underlying the contour plots are presented in Fig. S4.

