
Figure 4:
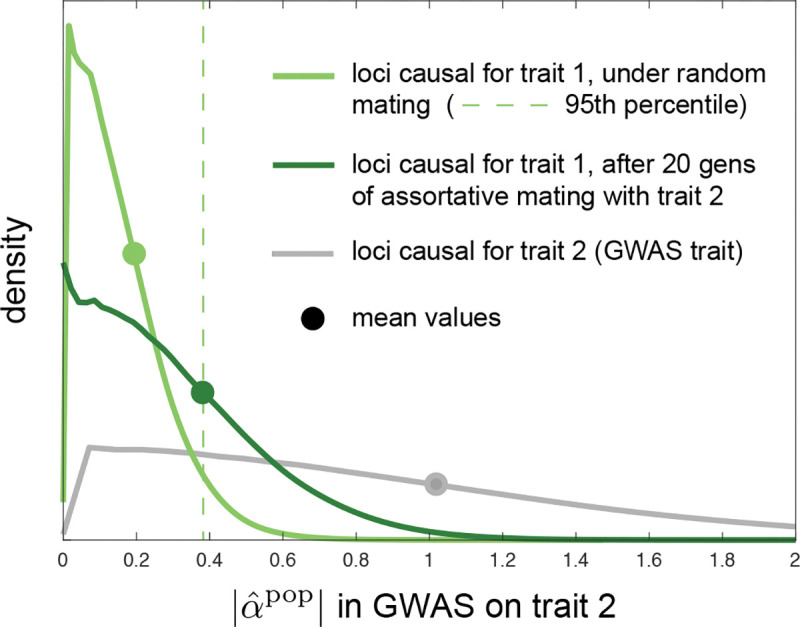
Cross trait assortative mating for traits with different genetic architectures can generate large spurious effect size estimates in population GWASs. Here, the traits have equal heritability, but the number of loci contributing variation to trait 1 is ten-fold smaller than that for trait 2. Shown, for a population GWAS on trait 2, are estimated distributions of the magnitude of effect size estimates at loci causal for trait 2 (grey) and at loci causal for trait 1 (greens), under random mating (light green) and after 20 generations of cross-trait assortative mating (sex-asymmetric, of strength ρ = 0.2) for traits 1 and 2 (dark green). Although the true effects of trait-1 loci on trait 2 are zero in these simulations (no pleiotropy), there is sampling noise in effect size estimation at trait-1 loci under random mating (light green line), so that the mean magnitude of effect size estimates is shifted away from zero (light green dot; dashed line displays 95th percentile under random mating). Under assortative mating, the magnitudes of the spurious effect size estimates at trait-1 loci shift significantly rightward (dark green line), coming to overlap substantially with the distribution of effect size estimate magnitudes at causal trait-2 loci (grey line; the distribution for trait-2 loci does not appreciably differ under random and assortative mating). Densities are estimated from pooled effect size estimates from 1,000 replicate simulations. Simulation details in Methods.