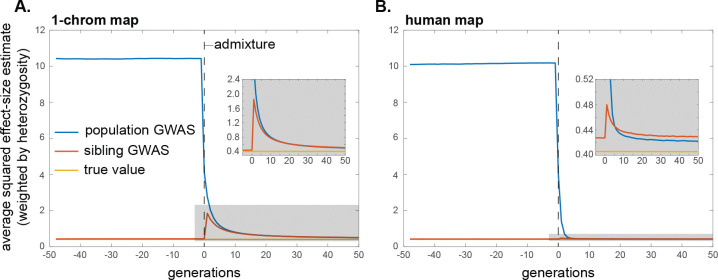
Figure 5:
The impact of population structure and admixture on the average squared effect size estimate in population and within-family GWASs. Here, two populations are isolated until generation 0, at which point they mix in equal proportions. Initial allele frequencies are chosen independently for the two populations, such that allele frequency differences between the populations resemble those that would accumulate over time via random drift. As in Fig. 3, the equilibrium value of the mean squared effect size estimate under random mating is greater than the true mean squared effect size, in both the population and within-family GWAS, owing to linkage disequilibria among causal alleles that arise due to drift. This explains why, in the insets, the blue (population) and red (within-family) profiles do not shrink all the way down to the yellow (true) line after admixture, when mating is random. Note too the difference in scale of the y-axes in the insets: the return to equilibrium is much more rapid under the human genetic map than for a hypothetical genome of one chromosome of length 1 Morgan, since, with more recombination, the ancestry-based linkage disequilibria are broken down more rapidly. Profiles are averages across 10,000 replicate simulation trials. Simulation details can be found in the Methods.

