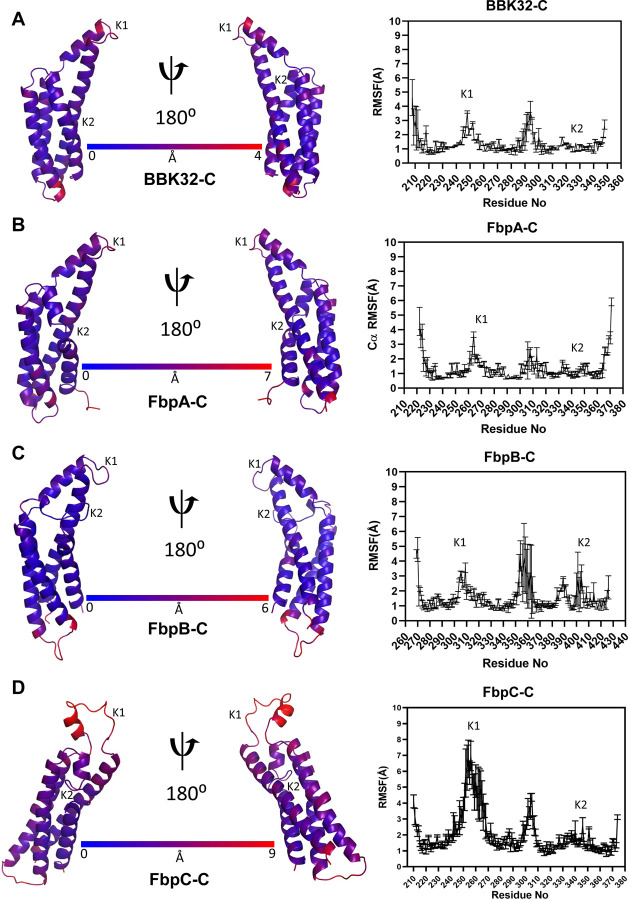
Figure 4. RMSF measurements.
Residue root mean square fluctuation (RMSF) values from a representative MD simulation of (A) BBK32-C, (B) FbpA-C, (C) FbpB-C and (D) FbpC-C were mapped onto structural models of each protein. Dark blue indicates the least flexible residues while dark red indicates the most flexible residues within each protein. On the right panels, RMSF values are shown as an average and standard deviation of three replicate simulations. The location of the K1 and K2 sites are marked.

