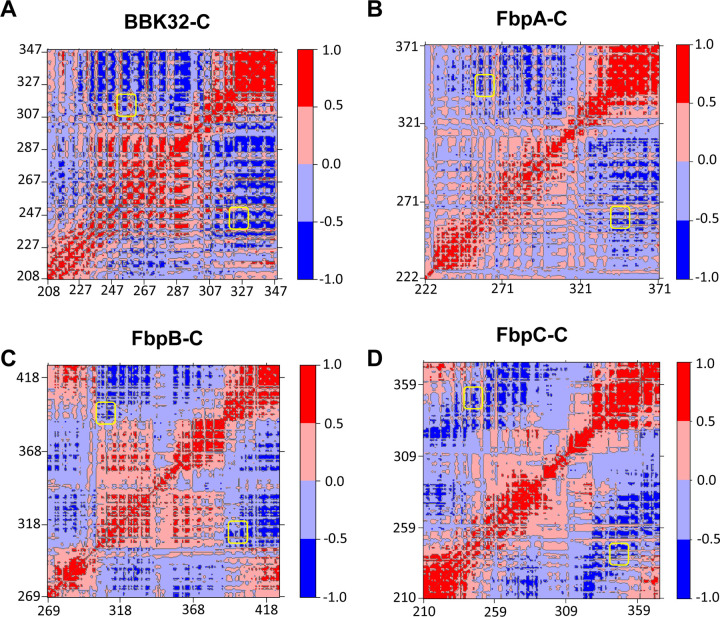
Figure 5. Cα DCCM Maps for borrelial C1r inhibitors.
Dynamic cross-correlation matrices (DCCM) maps are shown for representative simulations of (A) BBK32-C, (B) FbpA-C, (C) FbpB-C and (D) FbpC-C using a relative scale. Positive values (red) represent correlated motions, while negative values (blue) represent anti-correlated motions. Regions of the maps corresponding to K1 and K2 sites are highlighted by yellow boxes.

