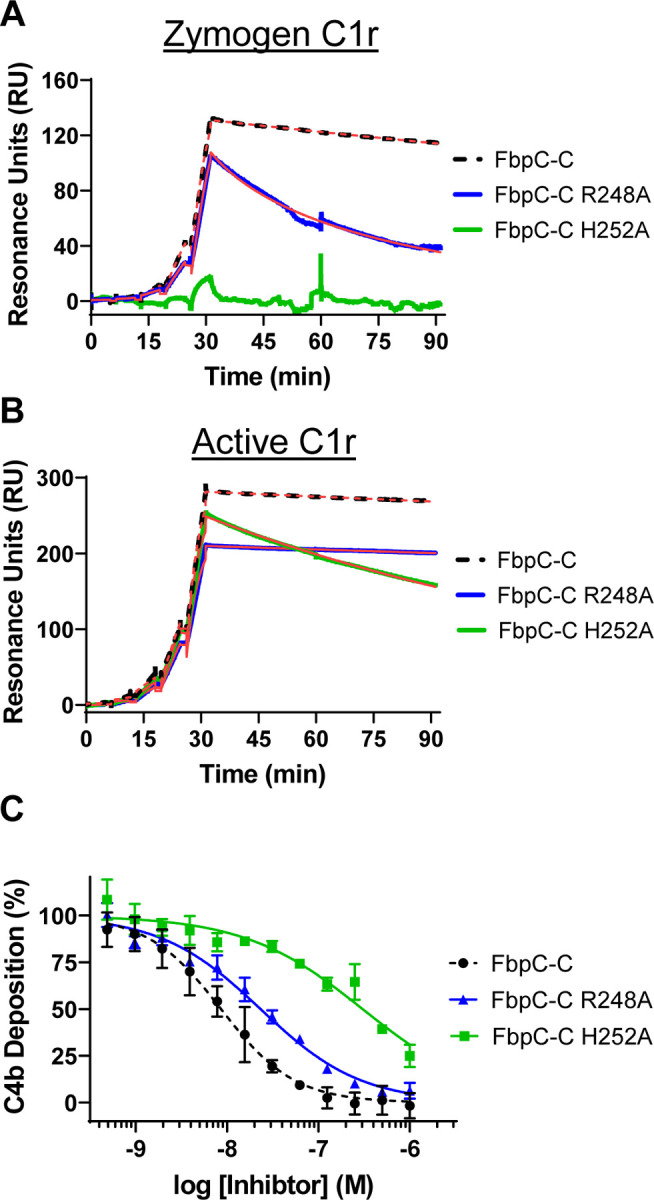
Figure 8. Assessing the function of the K1 site residues of FbpC-C.

Single-cycle SPR binding assays using a 0.16–100 nM fivefold dilution series of (A) zymogen or (B) active C1r over FbpC-C R248A and H252A. Sensorgrams are a representative injection series from three replicates with the raw sensorgrams overlaid with kinetic fits traced in red. A kinetic fit for zymogen C1r binding to FbpC-C H252A was unable to be determined and is shown only as the raw sensorgram. Calculated KD values and association (ka) and dissociation (kd) rate constants for each analyte were determined and are shown as the mean ± SD (Table 2). Representative sensorgrams for analogous experiments using “wild-type” FbpC-C are replotted from Fig. 2 for sake of comparison and are delineated by dashed lines. C) C4b deposition was dose-dependently inhibited in a CP-specific complement ELISA incubated with FbpC-C R248A and FbpC-C H252A. CP ELISAs were performed in triplicate followed by a non-linear variable slope regression fit to determine IC50 values (Table 2). Representative dose-response inhibition curves for analogous experiments using “wild-type” FbpC-C are replotted from Fig. 2 for sake of comparison and are delineated by dashed lines.
