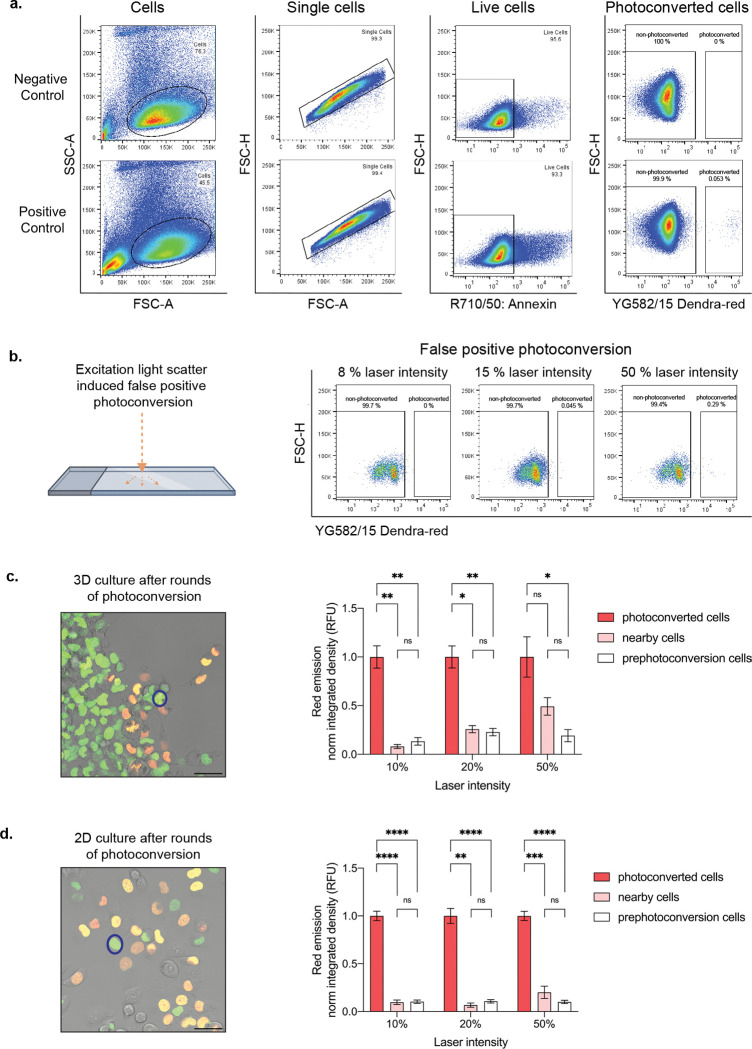
Fig. 5 |. Cell selection and isolation optimization.
a. Flow plots illustrating stepwise isolation of live photoconverted cells. 8 % 405 nm laser line intensity utilized in positive control. b. False positive photoconverted cells due to light reflection off the glass plate at varying photoconversion laser intensities at 405 nm. c. Representative merged image showing photoconversion of multiple cells (orange and yellow cells) in 3D, where intensity change is measured in a neighboring, non-photoconverted cell (representative nearby cell,  ). Quantification showing fold change of normalized red emission after rounds of photoconversion are complete. d. Representative merged image showing photoconversion in multiple cells (orange and yellow cells) in 2D, where intensity change is measured in a neighboring, non-photoconverted cell (representative nearby cell,
  ). Quantification showing fold change of normalized red emission after rounds of photoconversion are complete. *p < 0.05 by one-way ANOVA with Tukey’s multiple comparisons test. Scale bar, 50 μm.

