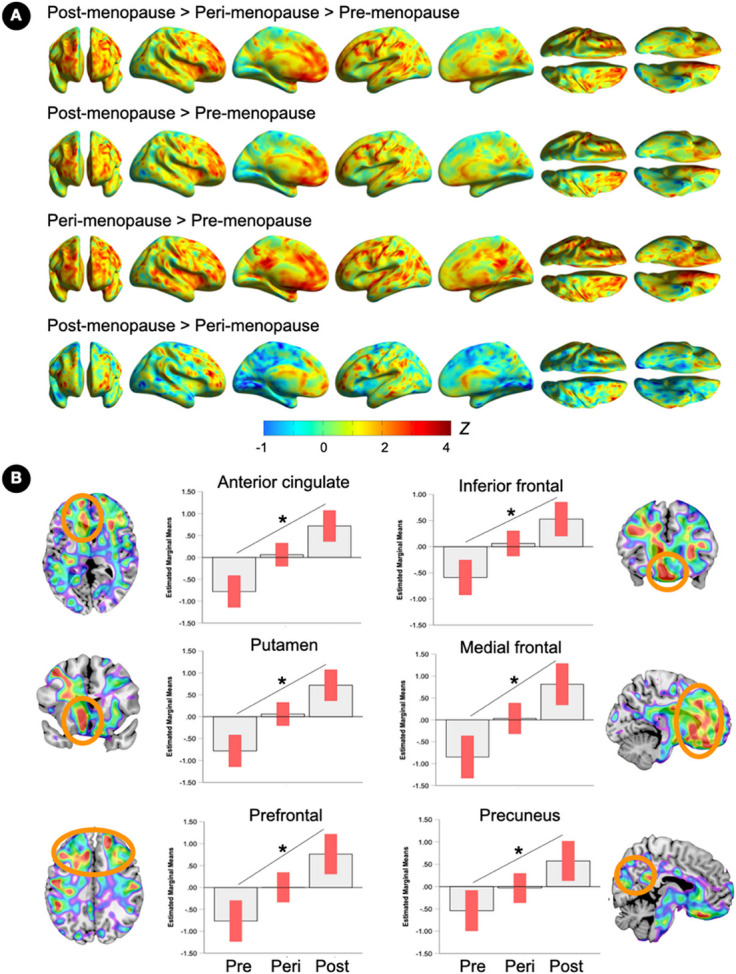
Figure 1. Brain estrogen receptor density by menopause stage.

(A) Surface maps of regional 18F-FES estrogen receptor (ER) density differences between pre-menopausal, peri-menopausal and post-menopausal groups (N=15 each), at family-wise error (FWE) corrected cluster-level P<0.05, adjusted by age, plasma estradiol levels and cerebellar uptake. Statistical parametric maps are represented on a spectrum color-coded scale with corresponding Z scores. Statistics are reported in Table 2.
(B) Coronal, sagittal or axial slice overlays superimposed on a volumetric template MRI with corresponding plots representing estimated marginal mean signal from peak clusters. Error bars are 95% confidence intervals; *Overall effect, P<0.05. Abbreviations: Peri, peri-menopause; Post, post-menopause; Pre, pre-menopause.
