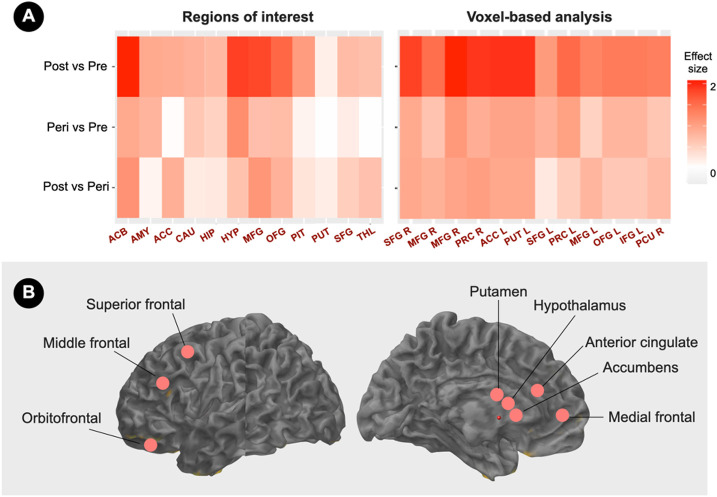
Figure 2. Menopause status classification by brain estrogen receptor density.
(A) Standardized pairwise mean estrogen receptor (ER) density differences in pre-specified regions of interest (left) and voxel-based analysis clusters (right) between menopause statuses are expressed as Cohen’s d coefficients, where d≥0.8 reflects a large effect size.
(B) Schematic illustration of brain regions yielding maximum group separation, superimposed on a volumetric template MRI image.
Abbreviations: ACB, accumbens; ACC, anterior cingulate; AMY, amygdala; CAU, caudate, HIP, hippocampus, HYP, hypothalamus; IFG, inferior frontal gyrus; L, left; MFG, middle frontal gyrus; OFG, orbitofrontal gyrus; Peri, peri-menopause; PCU, precuneus; PIT, pituitary; Post, post-menopause; PRC, precentral gyrus; Pre, pre-menopause; PUT, putamen; R, right; SFG, superior frontal gyrus; THAL, thalamus.

