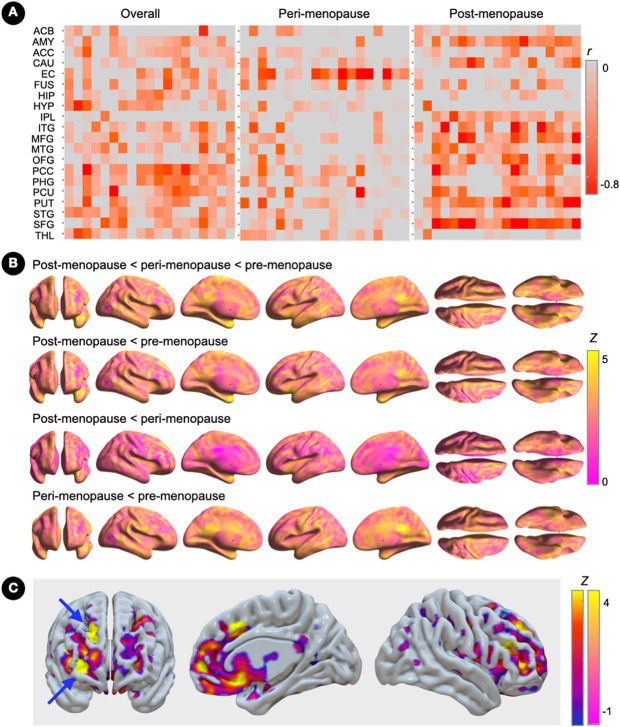
Figure 3. Associations of brain estrogen receptor density and gray matter volume.
(A) Covariate-adjusted associations between estrogen receptor (ER) density and gray matter volume (GMV) in the full regions-of-interest panel, and corresponding partial correlation r coefficients.
(B) Surface maps of regional GMV differences between pre-menopausal, peri-menopausal and post-menopausal groups (N=15 each), at family-wise error (FWE) corrected cluster-level P<0.05, adjusted by age and total intracranial volume. Statistical parametric maps are represented on a color-coded scale with corresponding Z scores. Statistics are reported in Supplementary Table 2.
(C) Statistical parametric maps showing overlapping effects of menopause status on ER density (blue-to-yellow color scale) and GMV (pink-yellow color scale) superimposed on the anterior, right medial and lateral views of a volume-rendered template MRI. Arrows point to peak clusters of negative correlations between modalities (bright yellow).
Abbreviations: ACB, accumbens; ACC, anterior cingulate; AMY, amygdala; CAU, caudate; EC, entorhinal cortex; FUS, fusiform; HIP, hippocampus, HYP, hypothalamus; IPL, inferior parietal lobe; ITG, inferior temporal gyrus; L, left; MFG, middle frontal gyrus; MTG, middle temporal gyrus; OFG, orbitofrontal gyrus; Peri, peri-menopause; PCC, posterior cingulate cortex; PHG, parahippocampal gyrus; Post, post-menopause; Pre, pre-menopause; PUT, putamen; R, right; SFG, superior frontal gyrus; STG, superior temporal gyrus; THAL, thalamus.

