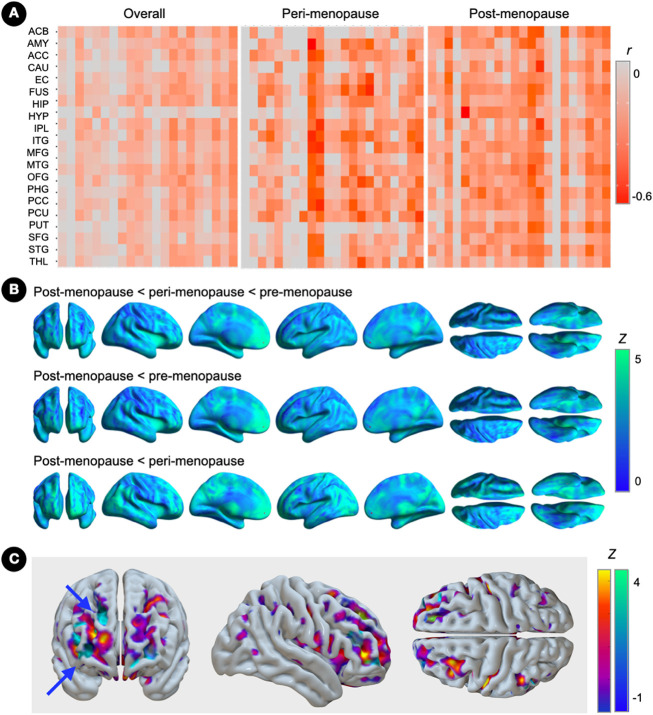
Figure 4. Associations of brain estrogen receptor density and cerebral blood flow.
(A) Covariate-adjusted associations between estrogen receptor (ER) density and cerebral blood flow (CBF) in the full regions-of-interest panel, and corresponding partial correlation r coefficients.
(B) Surface maps of regional CBF differences between pre-menopausal (N=15), peri-menopausal and post-menopausal groups (N=14 each), at family-wise error (FWE) corrected cluster-level P<0.05, adjusted by age and global activity. Statistical parametric maps are represented on a color-coded scale with corresponding Z scores. Statistics are reported in Supplementary Table 3.
(C) Statistical parametric maps showing overlapping effects of menopause status on ER density (blue-to-yellow color scale) and CBF (blue-green color scale) superimposed on the anterior, right medial and lateral views of a volume-rendered template MRI. Arrows point to peak clusters of negative correlations between modalities (bright blue).
Abbreviations: see legend to Figure 3.

