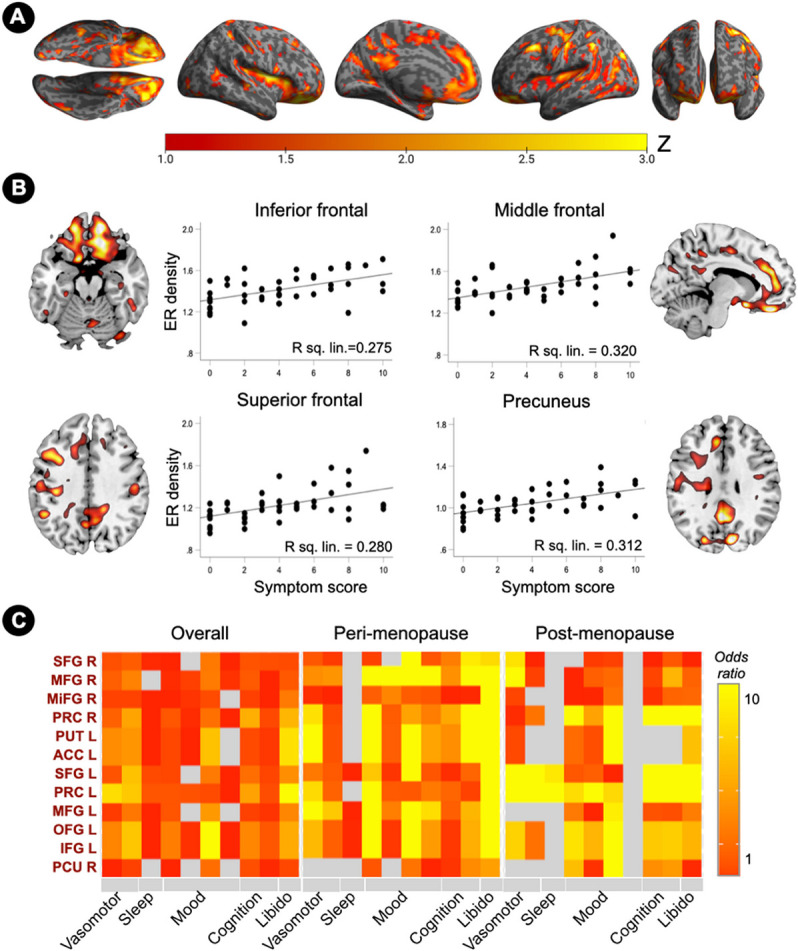
Figure 6. Associations of brain estrogen receptor density and menopause symptoms.

(A) Surface maps of regional associations between estrogen receptor (ER) density and menopause symptom scores, at cluster-level PFWE<0.05, adjusted by age and cerebellar uptake. Statistical parametric maps are represented on a color-coded scale with corresponding Z scores. Statistics are reported in Supplementary Table 4.
(B) Sagittal or axial slice overlays superimposed on a volumetric template MRI and corresponding correlation plots of standardized uptake value ratios (SUVR) from peak clusters and menopause symptoms scores.
(C) ER density predicts presence of menopause symptom clusters. Odds ratios are estimated for the entire sample (N=45) and separately for peri-menopausal and post-menopausal groups (N=15 each), and displayed on a color-coded scale. Abbreviations: see legend to Figure 2.
