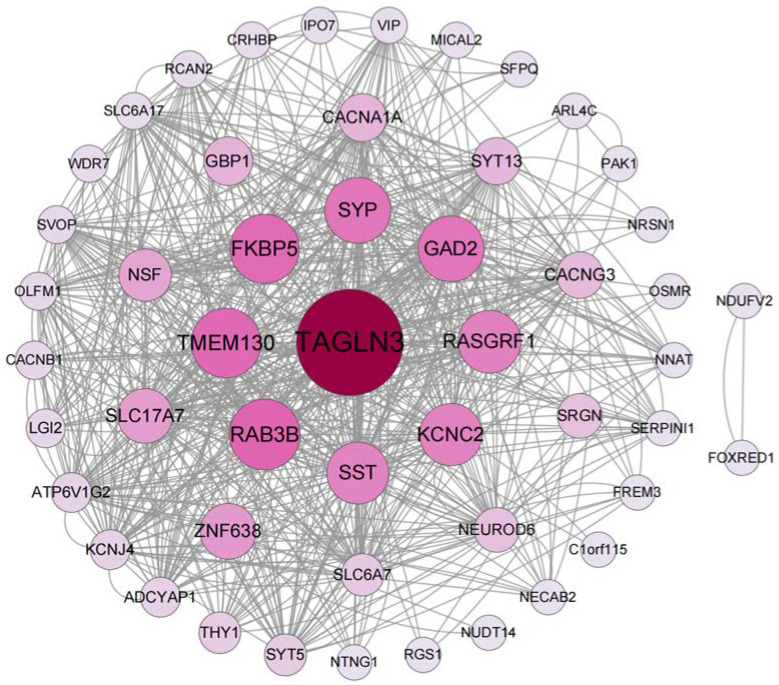
Figure 5.
The PPI network of the identified common DEGs among COVID-19, AD, and PD. The network, including 52 nodes and 320 edges, is generated using String and visualized in Cytoscape. The circle nodes represent the DEGs, and the edges represent the interactions between the nodes; the size and color depth of the nodes are based on the Betweenness Centrality (BC) values.

