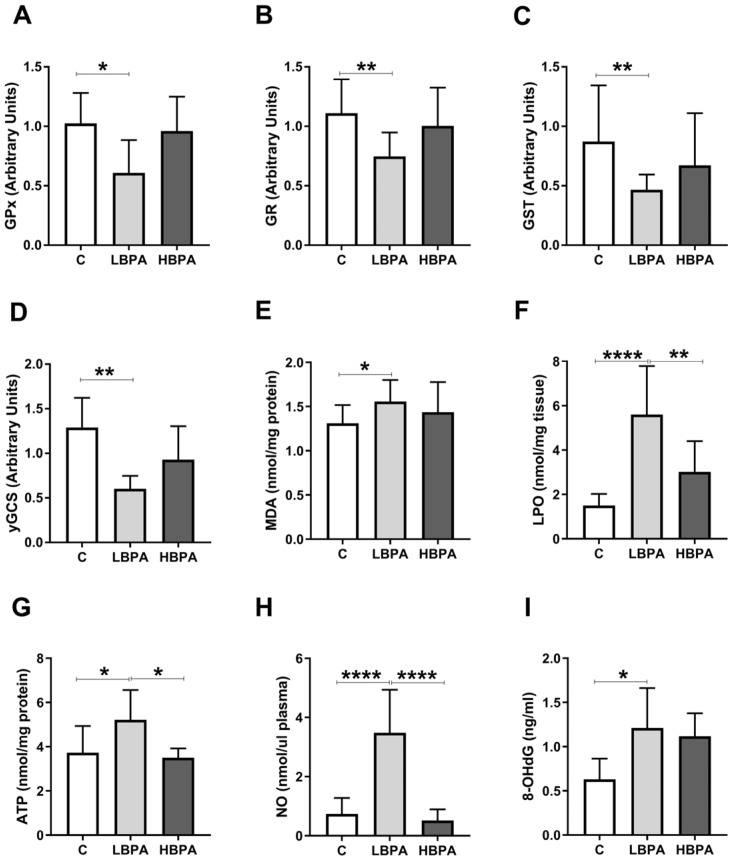
Figure 3.
Gene expression profile of GSH-related enzymes and parameters of oxidative damage in livers from lactating dams after exposure to different doses of BPA. (A) Glutathione peroxidase (GPx), (B) glutathione reductase (GR), (C) glutathione S-transferase (GST) and (D) γ-glutamylcysteine synthetase (γ-GCS) relative gene expression. (E) Malondialdehyde (MDA) content in nmol/mg protein. (F) Lipid hydroperoxide (LPO) content in nmol/mg tissue. (G) Adenosine triphosphate (ATP) levels in nmol/mg protein. (H) Concentration of nitric oxide metabolites (NO) in nmol/μL plasma. (I) Concentration of 8-oxo-2′-deoxyguanosine (8-OHdG) in ng/mL. Data represent mean ± SD. For mRNA, n = 8 control dams; n = 8 LBPA dams; n = 6 HBPA dams (three replicates for each gene). For ELISA assay, n = 8 control dams; n = 8 LBPA mg/kg dams; n = 6 HBPA dams (two replicates for each sample). Statistical significance was determined by one-way ANOVA. * p < 0.05; ** p < 0.01; **** p < 0.0001.

