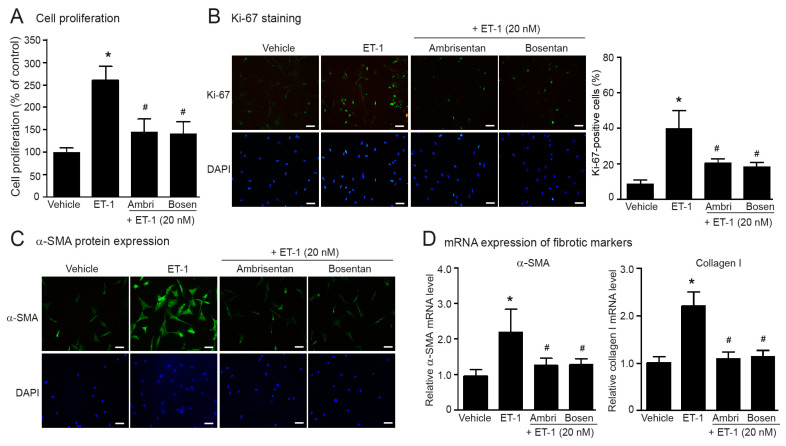
Figure 5.
Preventive effects of ERAs on ET-1-induced cell proliferation and myofibroblast differentiation. Cells were pretreated without or with ambrisentan (1 µM) or bosentan (1 µM) for 1 h before treatment with 20 nM ET-1 for 24 h (A–C) or 12 h (D). (A) Cell proliferation was calculated as the percentage relative to the control group. (B) Cells were stained for Ki-67 (green) and nucleus DAPI (blue). Scale bar, 10 µm. Proliferative capacity was calculated as the percentage of Ki-67-positive cells. (C) α-SMA protein expression was visualized by fluorescent microscope. Cells were stained for α-SMA (green) and nucleus DAPI (blue). Scale bar, 10 µm. (D) Relative α-SMA and collagen I mRNA levels determined by RT-qPCR were calculated as fold over the vehicle-treated group. Data were expressed as the mean ± SD. (n = 4). * p < 0.05 vs. vehicle; # p < 0.05 vs. ET-1.

