
Figure 1.
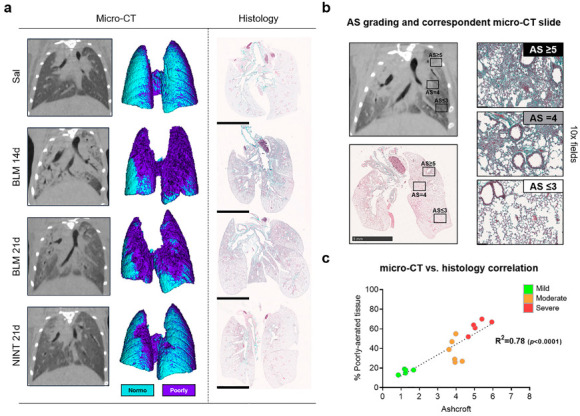
(a) For each treatment group, representative coronal 2D micro-CT lung slices are followed by their relative 3D renderings (on the left) and representative whole lung sections are stained with Masson’s trichrome (on the right). In micro-CT renderings, cyan represents the normally aerated tissue while purple regions correspond to poorly aerated tissue; (b) Side-by-side comparison between micro-CT and histomorphometric readouts with the identification of different degrees of severity by Ashcroft score. (c) A simple linear regression comparing the average Ashcroft score with the % of poorly aerated tissue for each mouse (p < 0.0001). Green, orange, and red colors represent the three categories (mild, moderate and severe) defined by the average Ashcroft score value. NINT—nintedanib; BLM—bleomycin; and AS—Ashcroft score.