Figure 3.

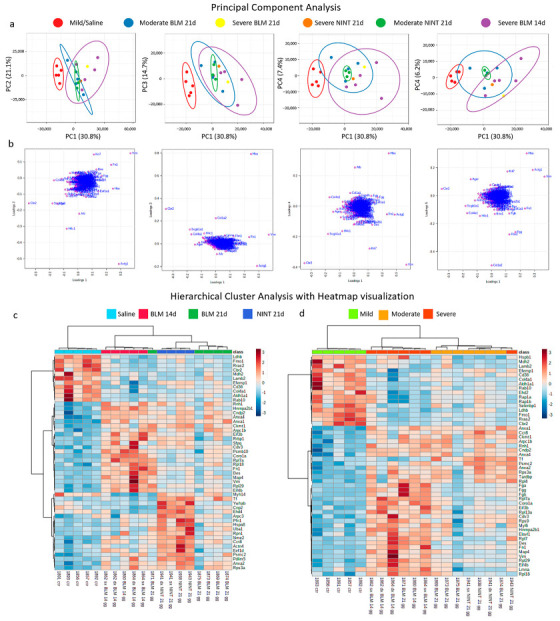
Multivariate Analysis. Principal Component Analysis (PCA): (a) 2D score plot between the following PCs, left-to-right: PC1-PC2, PC1-PC3, PC1-PC4, and PC1-PC5. The explained variances are shown in brackets. Pareto scaling is applied to rows, and singular value decomposition (SVD) with imputation is used to calculate principal components. Prediction ellipses are such that, with a probability of 0.95, a new observation from the same group will fall inside the ellipse. n = 19 data points; 2D score plots were created with Clustvis. (b) Loadings plots; loading plots were created with MetaboAnalyst 5.0. Hierarchical cluster analysis (HCA) with heatmap visualization based on (c) sample treatment and (d) the average histological grade. Heatmaps were created with MetaboAnalyst 5.0. The data were autoscaled; Pearson was used as a distance measure, and Ward as a clustering method. Heatmaps showed the top 50 features selected by t-test/analysis of variance (ANOVA). BLM—bleomycin; NINT—nintedanib; and d—days.
