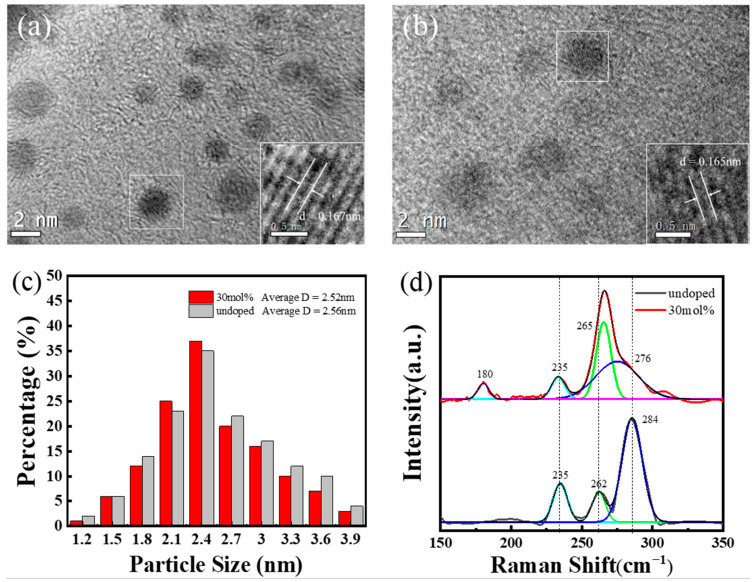
Figure 2.
(a) High-resolution TEM image of Cs3Bi2Cl9 QDs; (b) high-resolution TEM image of Cs3Bi2Cl9:Ce 30% QDs; (c) particle size distribution of Cs3Bi2Cl9 and Cs3Bi2Cl9:Ce 30% QDs; (d) Raman spectra of Cs3Bi2Cl9 and Cs3Bi2Cl9:Ce 30% QDs. The upper part: the red line is the experimental data of the sample doped with 30% Ce, and the other color lines are single-peak fitting, The lower part: the black line is the experimental data of undoped samples, and the other color lines are single-peak fitting.

