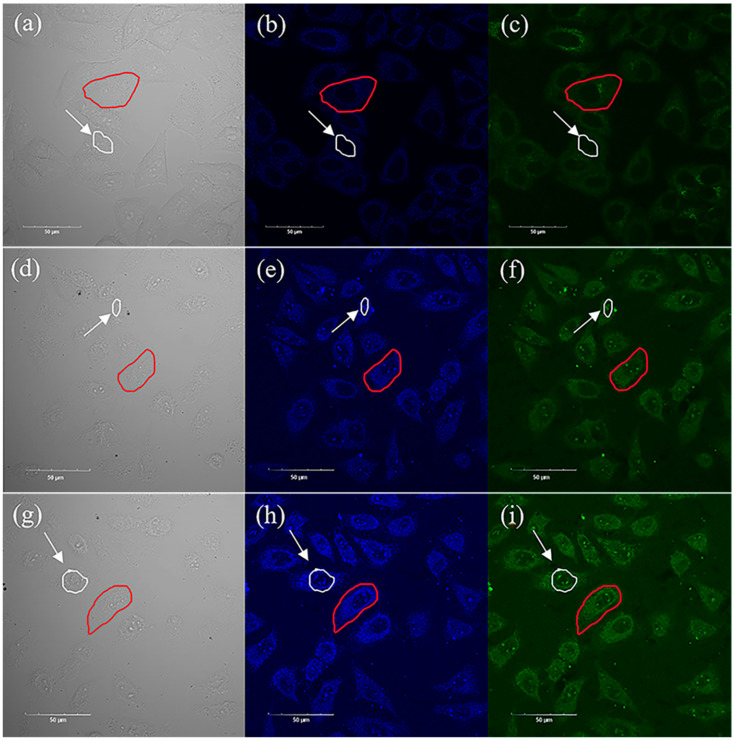
Figure 6.
(a–c) Brightfield images and fluorescence images of HepG2 cells in the control group, where (a) is the brightfield image, (b) is the fluorescence image with the blue channel, (c) is the fluorescence image with the green channel. (d–f) Brightfield images and fluorescence imaging of HepG2 cells co-incubated with Cs3Bi2Cl9 QDs for 24 h, where (d) is the brightfield image, (e) is the fluorescence image with the blue channel, (f) is the fluorescence image with the green channel. (g–i) Brightfield and fluorescence imaging of HepG2 cells incubated with Cs3Bi2Cl9:Ce 30% QDs for 24 h, where (g) is the brightfield image, (h) is the fluorescence image with the blue channel, and (i) is the fluorescence image with the green channel. The red circles in the figure show the target cells to be measured, the white circles and the arrows show the target cell nuclei, and the scale of the icon is 50 μm.

