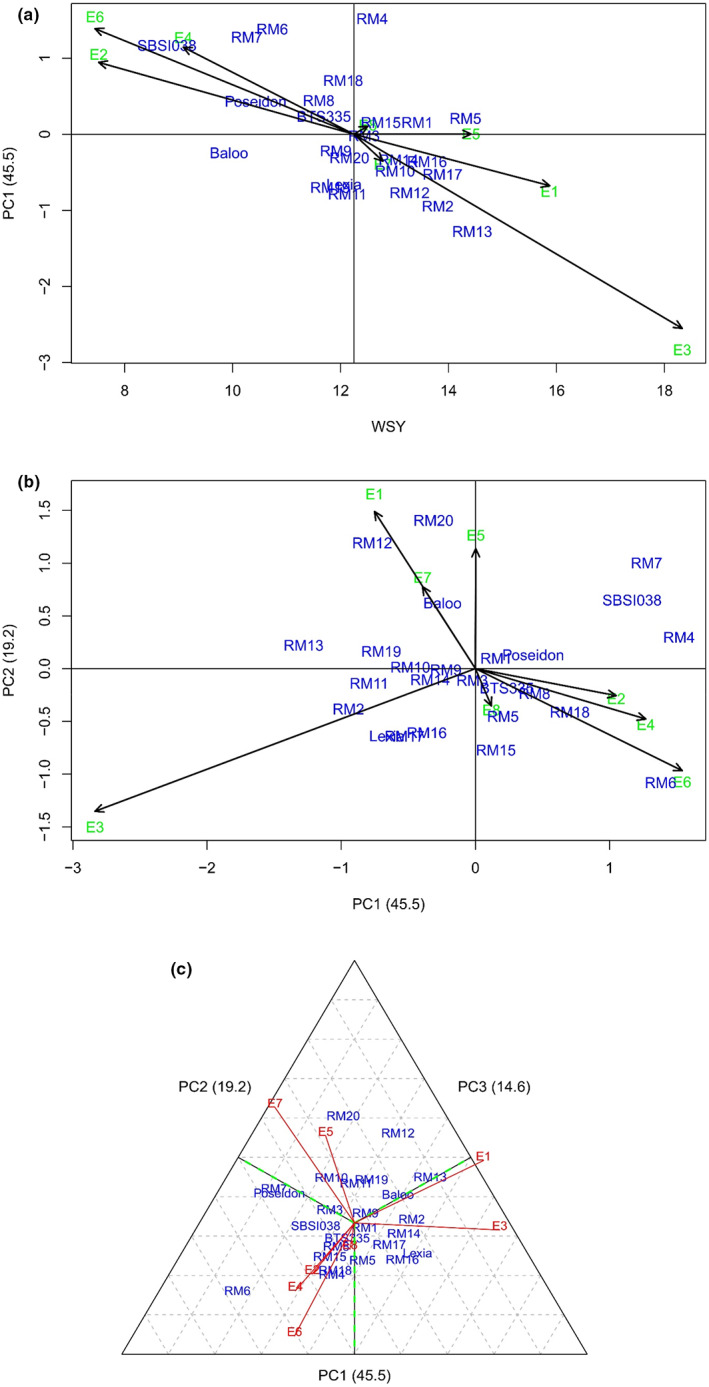
FIGURE 1.

(a) Scatter plot for genotypes and environments derived from yield means and a first principal component; (b) Scatter plot for genotypes and environments derived from the first two interaction principal components; (c) Scatter plot for genotypes and environments derived from the first three interaction principal components.
