
FIGURE 4.
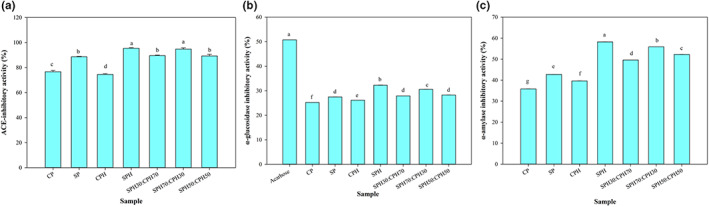
ACE (a), α‐glucosidase (b), and α‐amylase (c) inhibitory activities of unhydrolyzed proteins, hydrolysates and hydrolysate mixtures. The data marked with different letters are significantly different (p < .05). CP and SP indicate unhydrolyzed protein of corn and soy, respectively. CPH, SPH and different mixing ratios indicate hydrolysates of corn and soy, mixtures, respectively.